



How we use PostHog's built-in data warehouse

Contents
PostHog's data warehouse is our most powerful feature. It lets you sync data from the tools you already use like Stripe, Salesforce, and Hubspot, query it alongside your existing product data using SQL, and visualize it natively.
We built it because the modern data stack sucks. What starts as a handful of business critical tools devolves into dozens of tools, many specifically built to capture, clean, format, load, query, and visualize data.
We knew it didn't have to be this way, so we built the data warehouse to get rid of all this complexity and give you a single source of truth for all your business data.
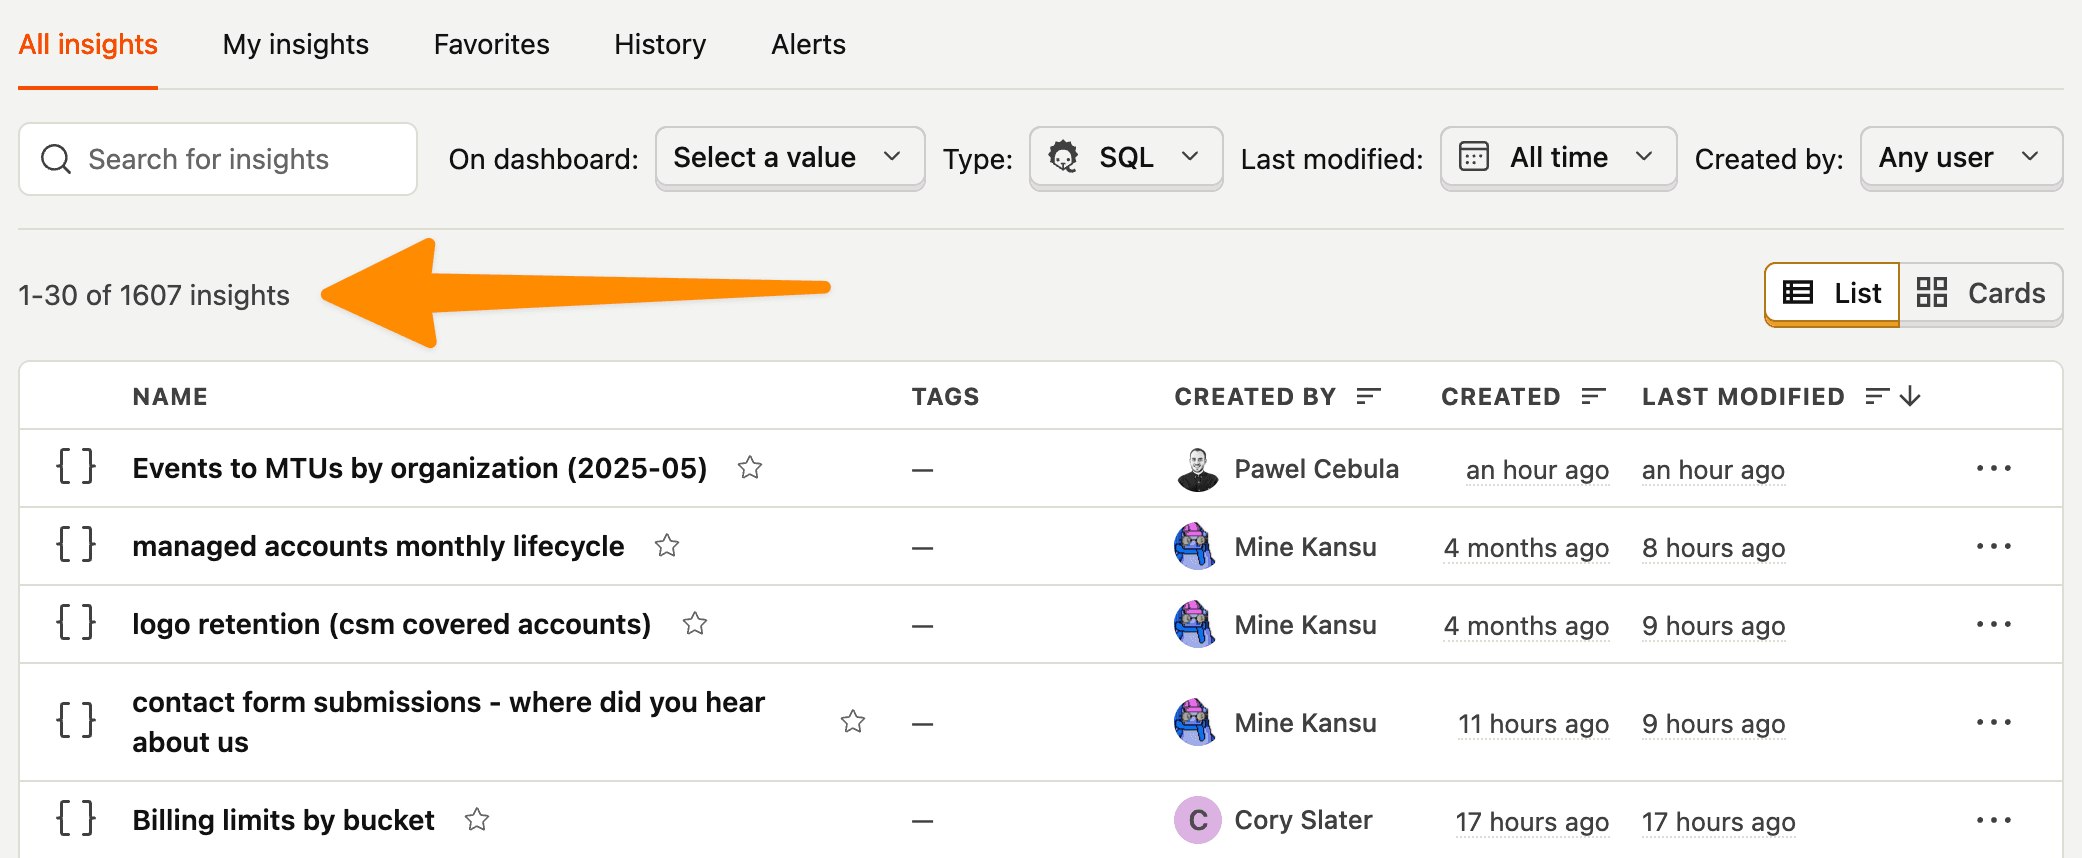
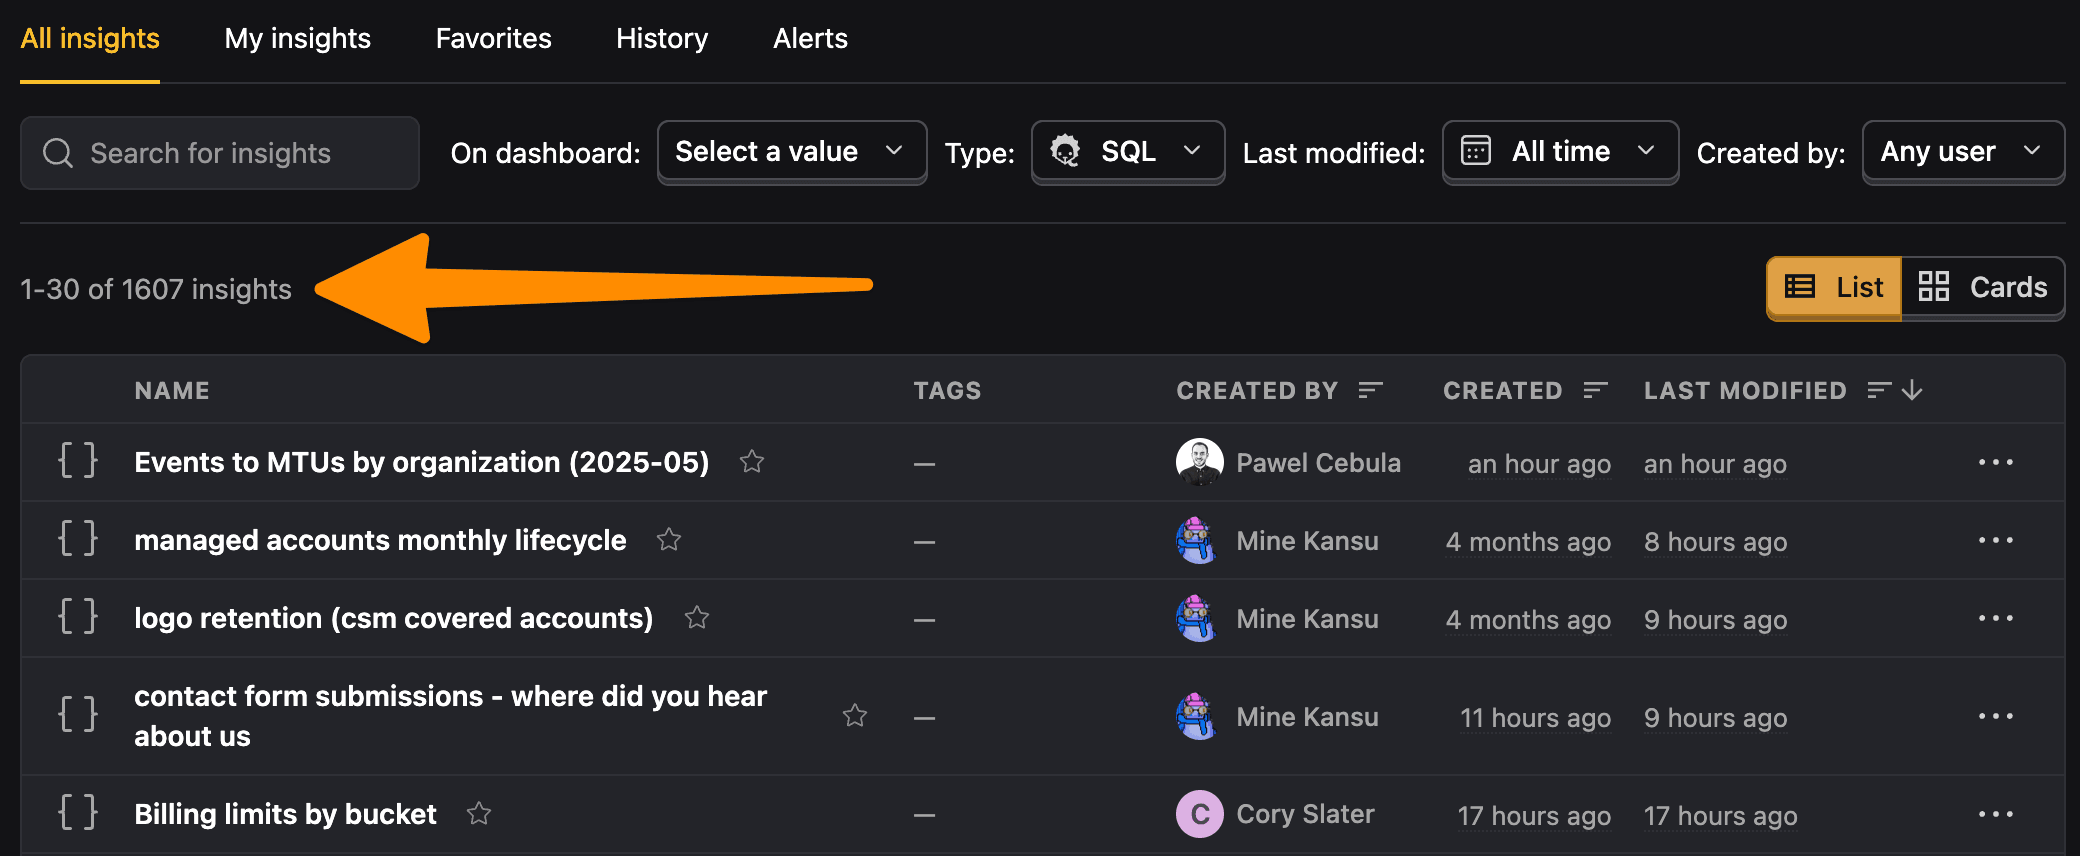
We've created over 1,600 SQL insights and visualizations using our data warehouse so far. It's our second most-used insight type behind trends, which was around long before we had the data warehouse.
To help you get started, we're sharing how teams at PostHog use our built-in data warehouse and custom SQL insights to answer critical business questions, like:
- Which customers churned and how did it impact revenue?
- Which customers are increasing their spend?
- Who are our biggest customers and what products are they using?
- Are we achieving our customer support goals?
- What are the biggest sales opportunities in our pipeline?
We're also sharing the actual SQL queries we use to answer these questions as well as the insights and dashboards we use to visualize the data (we've faked the data for the screenshots though).
Problem #1: Understanding growth and churn
- Sources:
- Postgres for billing data
- PostHog for usage and activation data
- Salesforce for sales context (e.g. ICP scores)
- Tables:
postgres_invoice_with_annual_view,postgres_billing_customer,events,salesforce.contact,postgres.posthog_team,postgres.posthog_organization,postgres_billing_usagereport
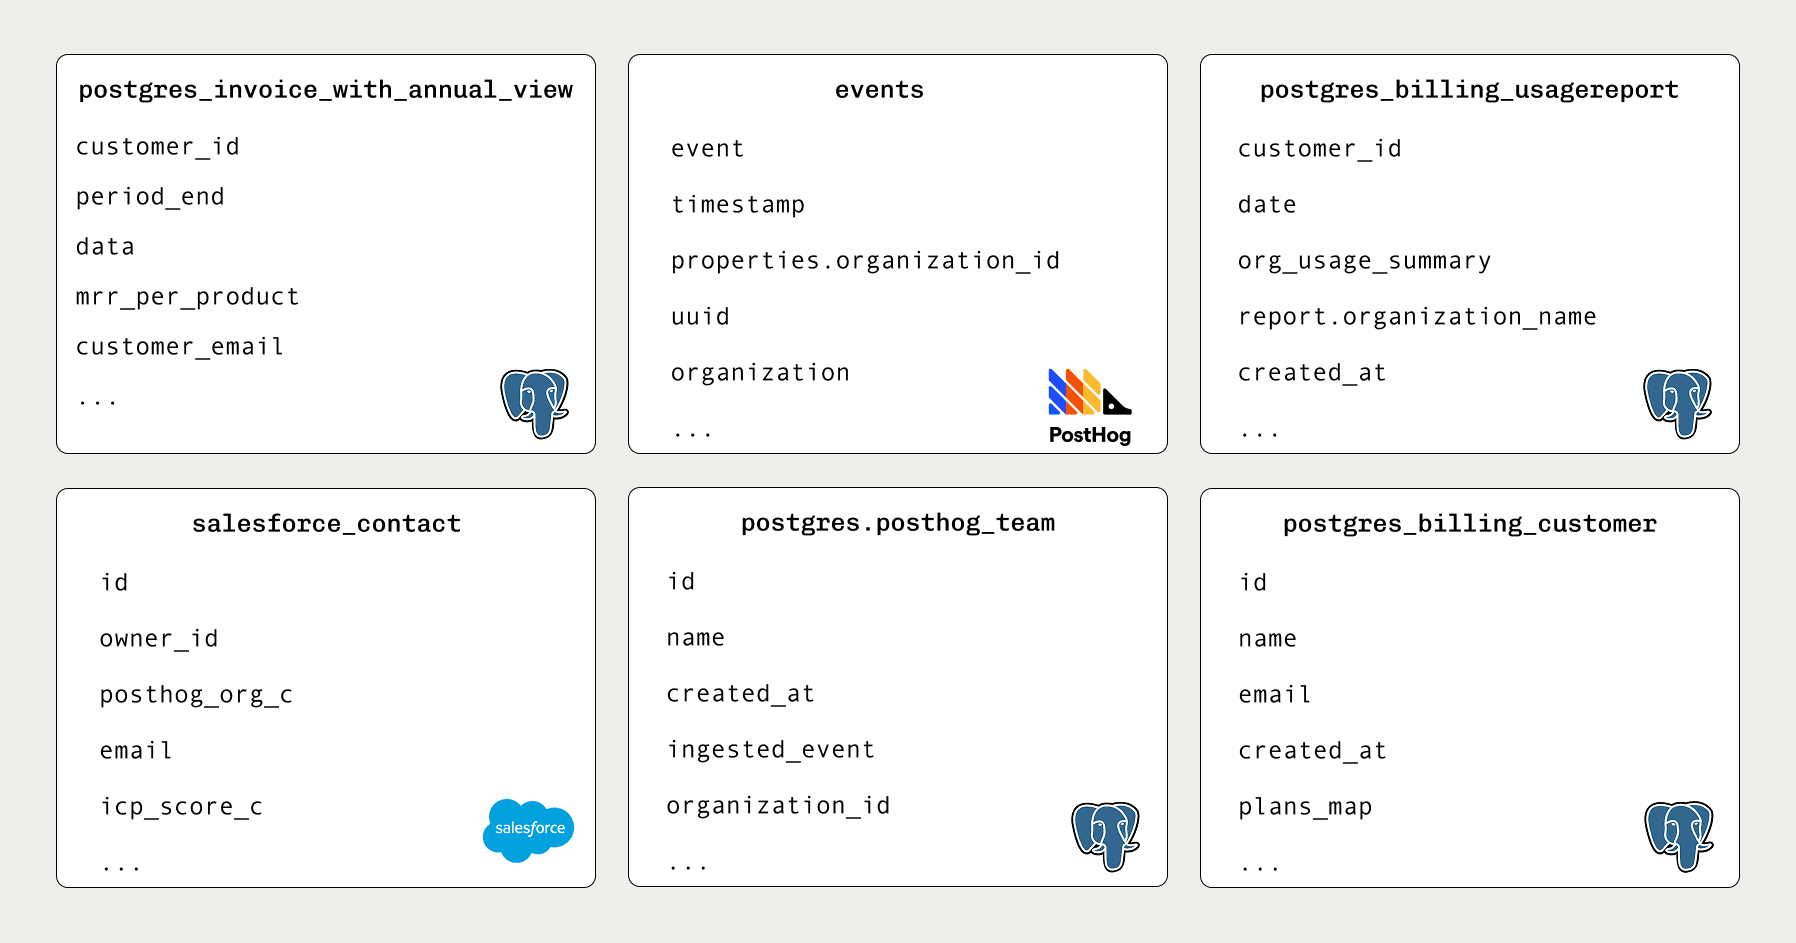
Engineers make the product decisions at PostHog, but they'd be lost without the context product managers provide.
One of the ways PMs give them this context is through monthly growth reviews, where they explore:
- Who churned, how much was their churn, and why (so we can prevent future churn)
- Product-specific activation and retention rates, using our custom definitions.
- Metrics for their growth reviews, like revenue expansion and contraction.
This analysis is only possible when you combine product and revenue data, so the data warehouse and SQL insights are their weapon of choice.
Most companies would use our Stripe source to import revenue data, but we don't. Since we have multiple different products with different usage-based pricing, we need a custom billing service to handle everything. The data from this service goes into Postgres, which then gets synced and used in PostHog.
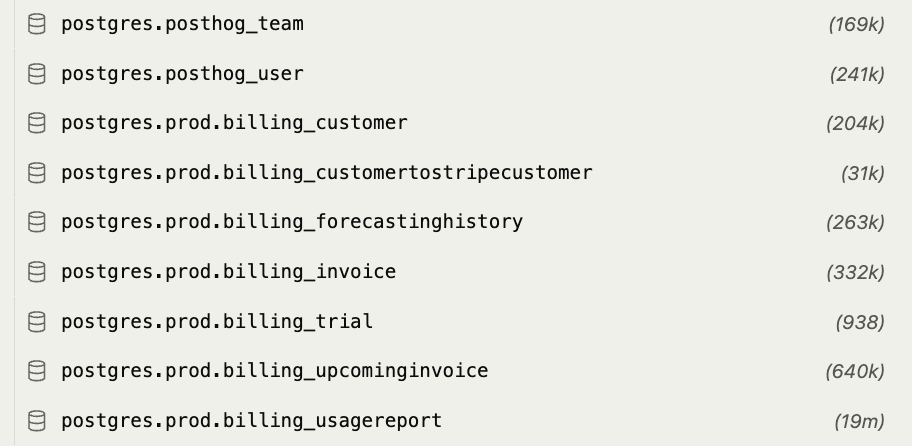
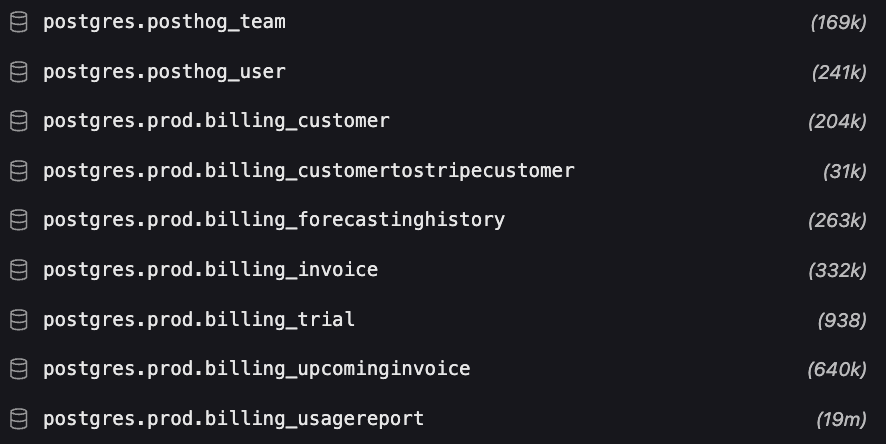
Product managers combine this billing data from Postgres with product analytics event and property data collected by PostHog, and some additional supplementary customer info imported from Salesforce.
From here they create specific SQL insights and combine them into a single dashboard like this one for error tracking:
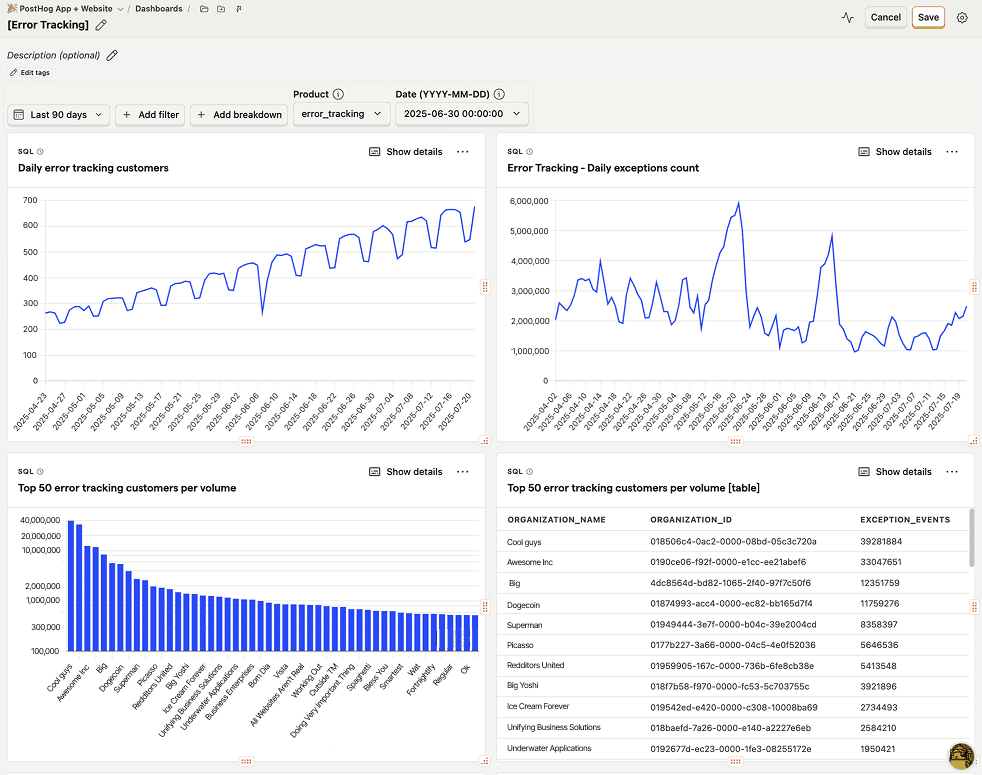
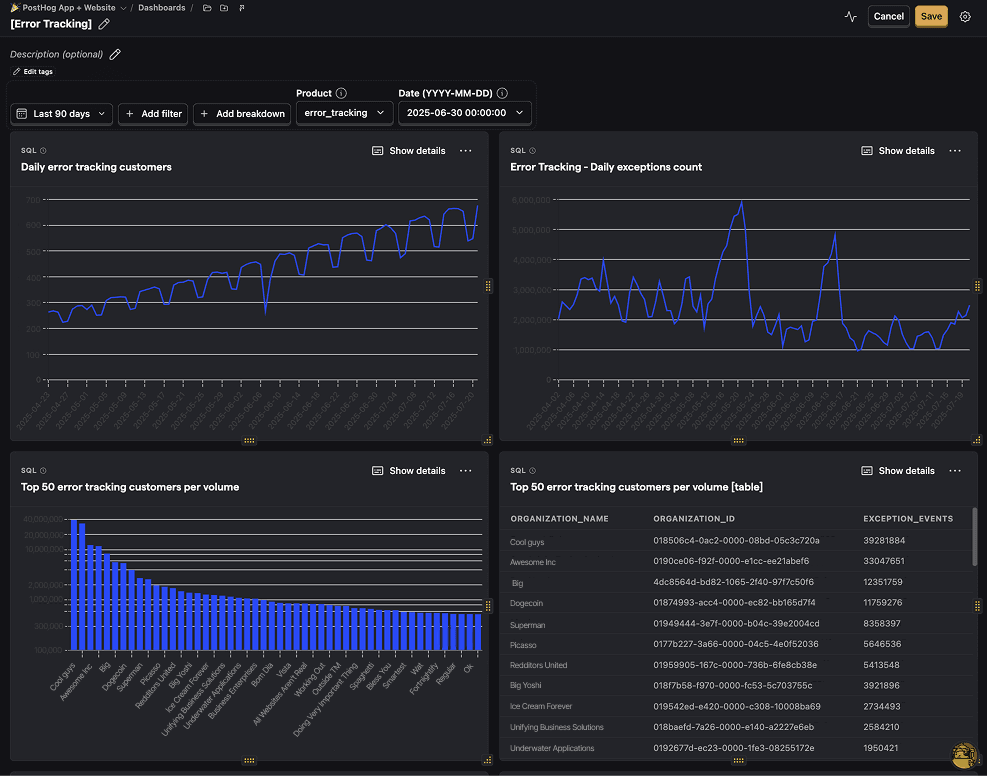
It includes insights like:
Top 50 error tracking customers by volume
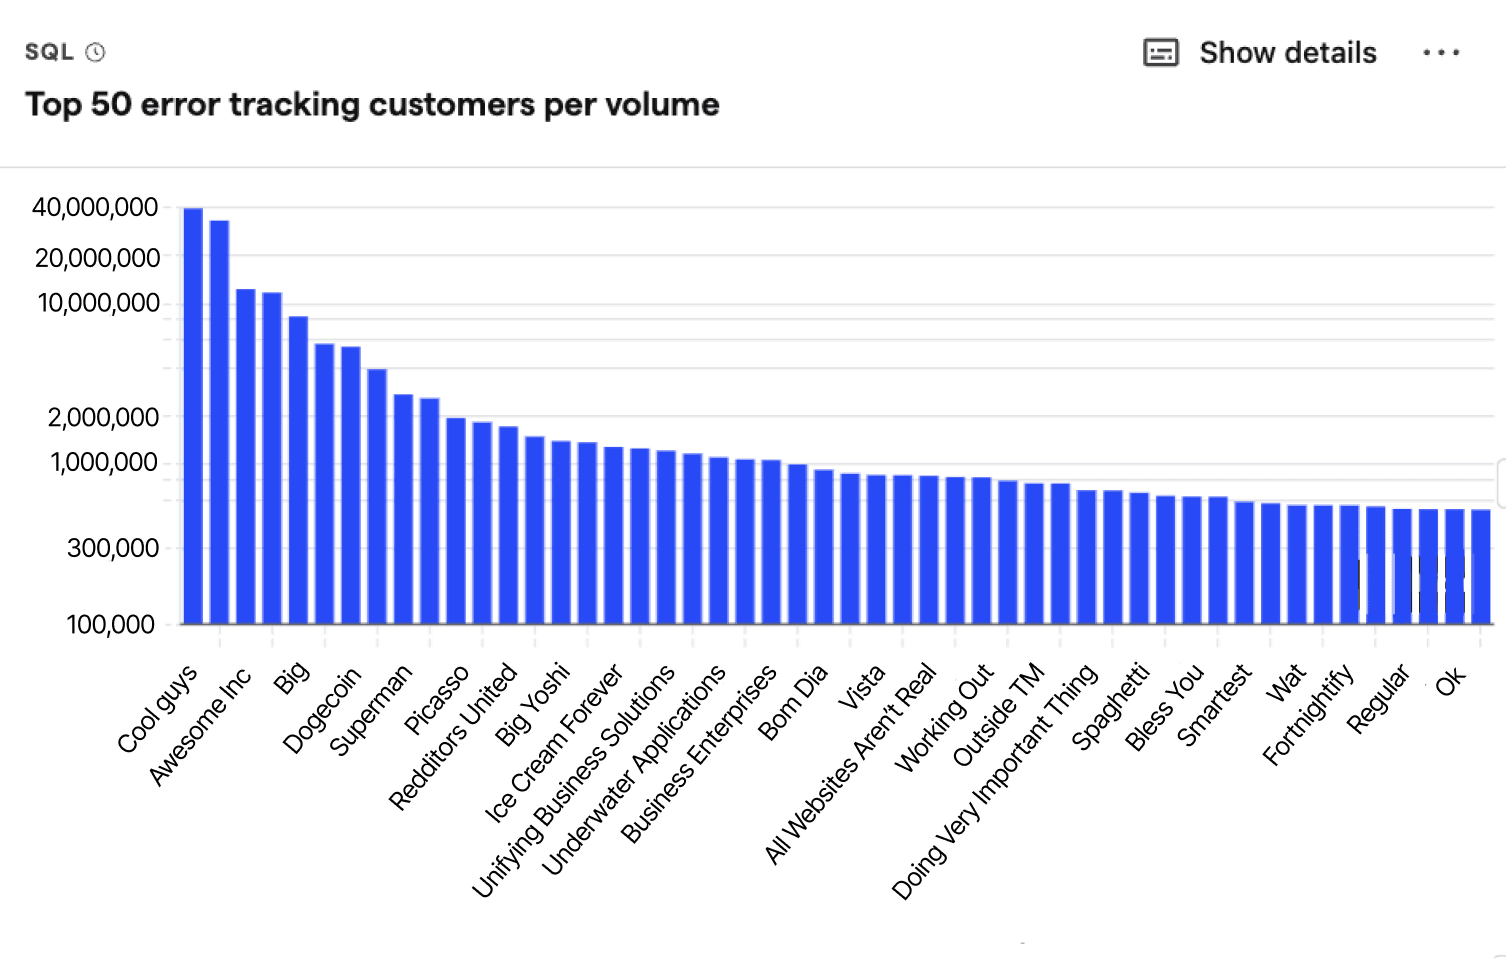
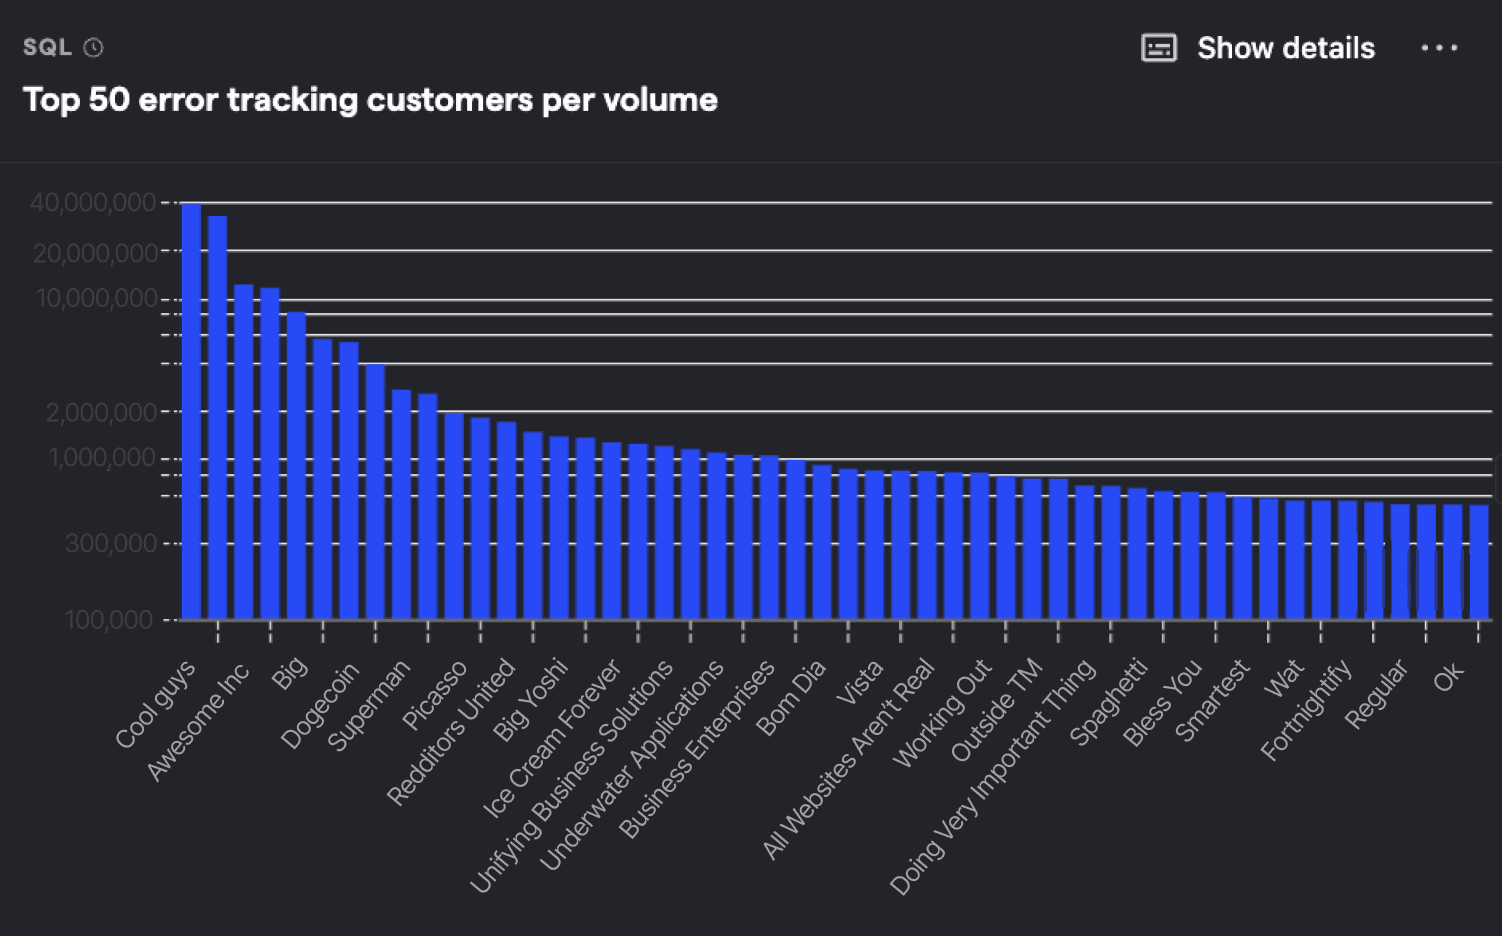
SQL query for top 50 error tracking customers by volume
Organizations regularly capturing exceptions (monthly)
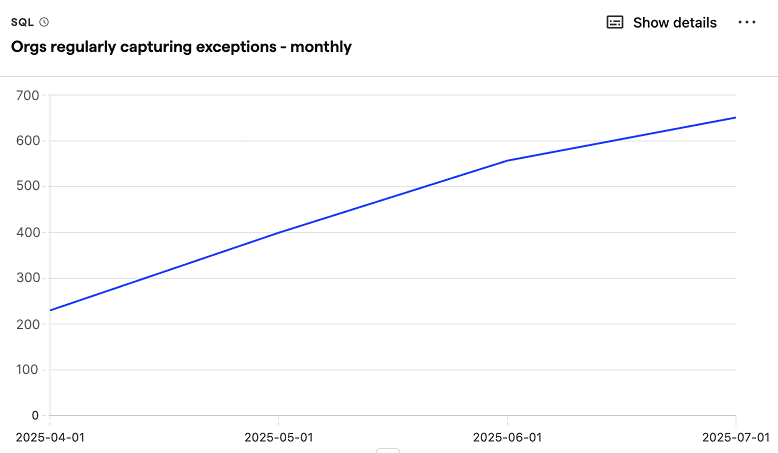
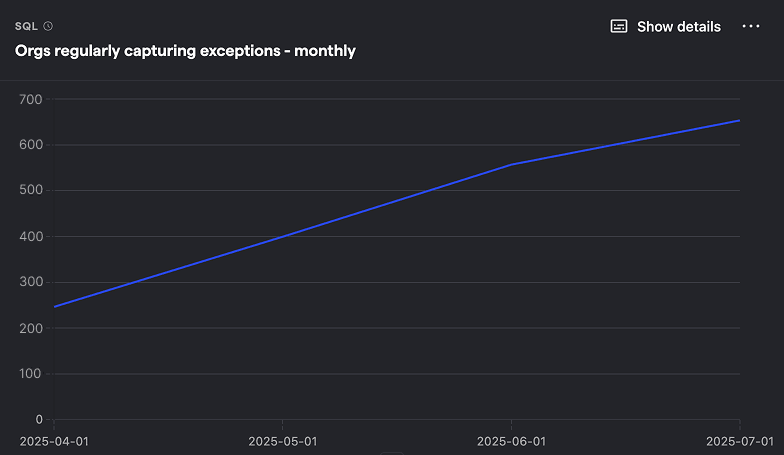
SQL query for organizations regularly capturing exceptions (monthly)
Error tracking churn for June
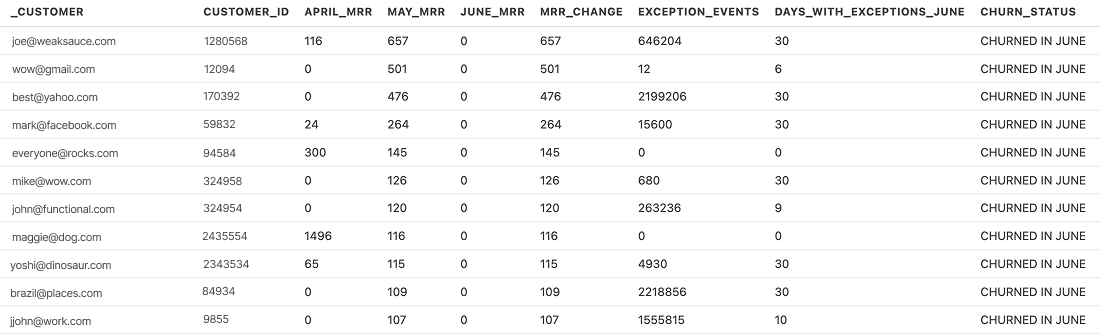
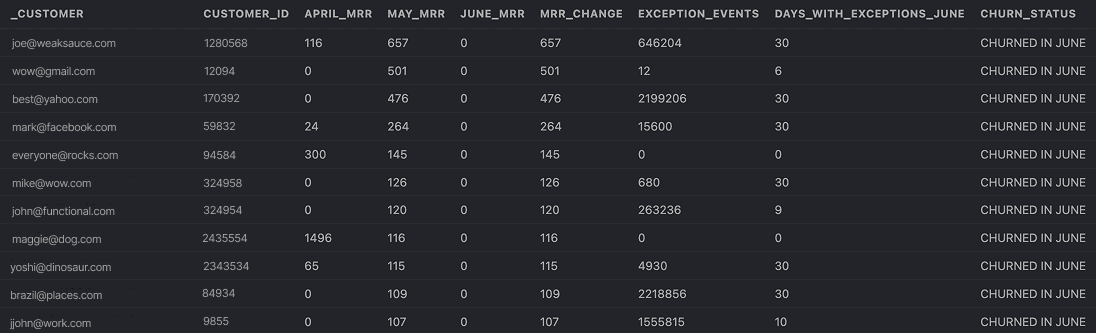
SQL query for error tracking churn for June
Using views to create reusable queries
Because product managers are slicing and dicing the data in multiple similar ways, they end up using a lot of views. These are saved queries that can be reused easily and can also be materialized for a speed up.
Views enable them to build a query to get the data they want in the format they want then use it to build multiple other queries. Some examples include:
org_icp_scores: Gets ICP scores for customers from Salesforce where they are calculated.feature_flags_activation_base: Builds a funnel of product intent → activation → retention, all centered on feature flags and enriched with an ICP score.source_of_truth_for_dp_pricing_model: Data on which customers are using pipelines, what volume they are doing, and more to help improve our data pipeline pricing.
Problem #2: Tracking revenue
- Sources:
- Postgres for billing data
- Salesforce for sales context (e.g. ICP scores)
- Tables:
postgres_invoice_with_annual_view,postgres_billing_customer,postgres_billing_usagereport,salesforce_opportunity
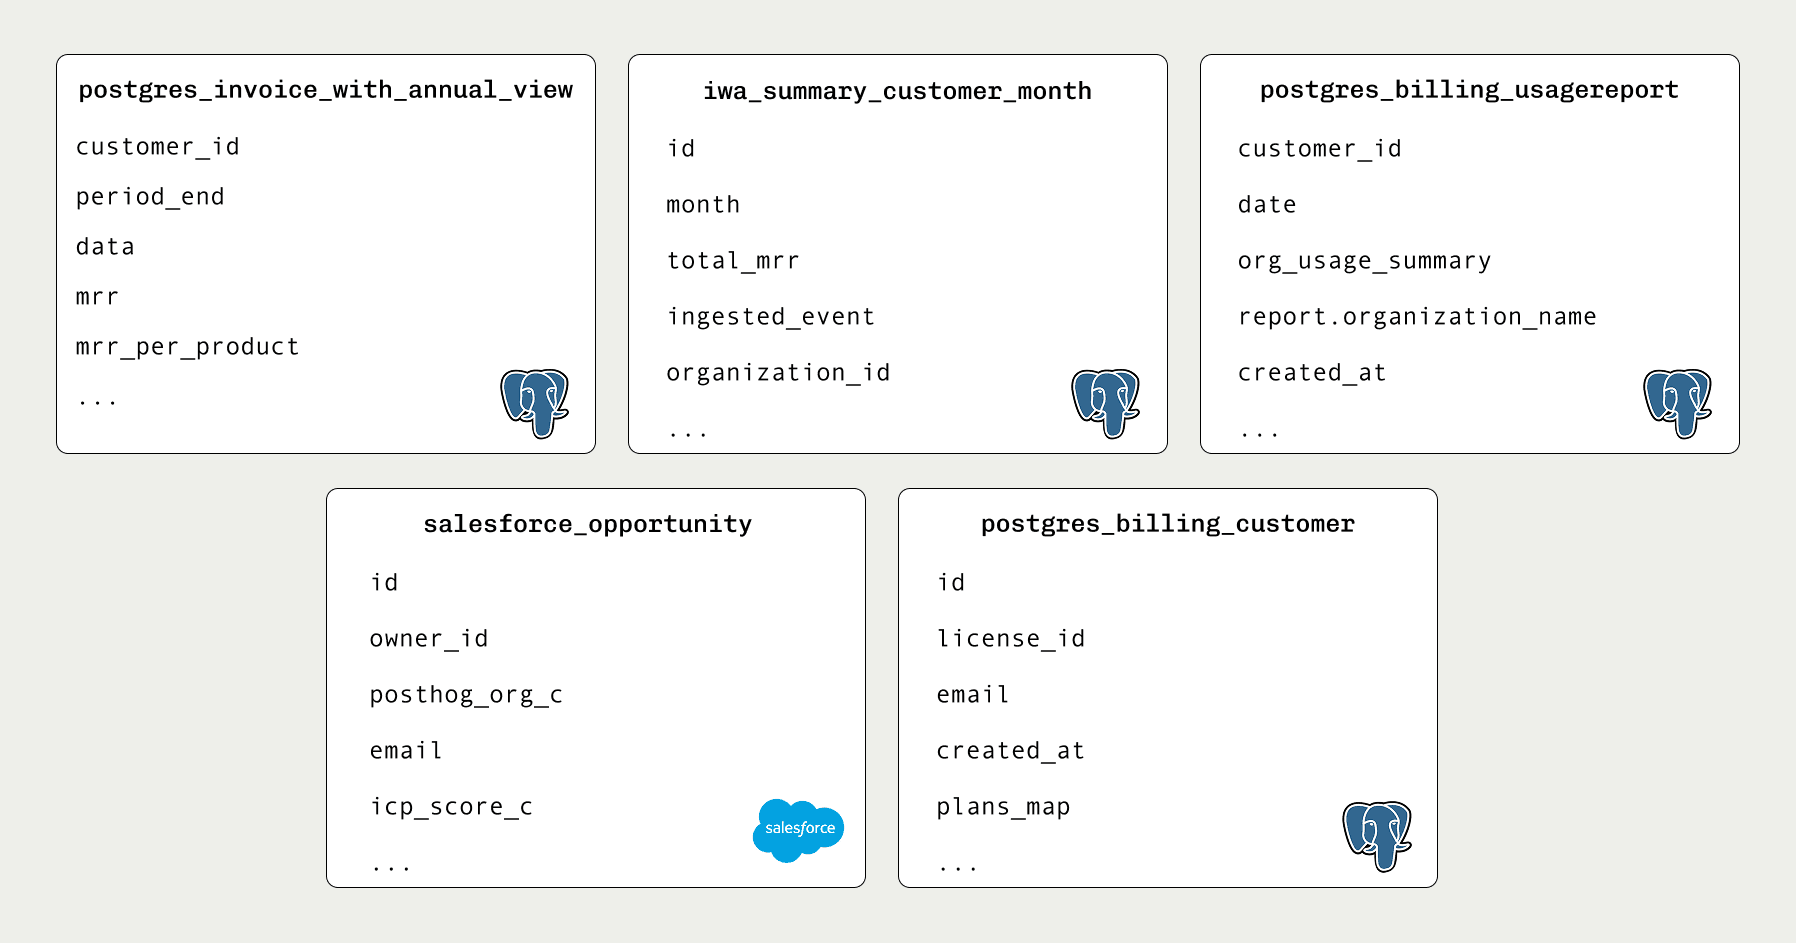
As I hinted at above, tracking revenue at PostHog is complicated. We have multiple products with usage-based and tiered pricing with discounts and add-ons, so we can't just query Stripe and get our revenue data. We have a specific billing service that generates invoices and reports, and adds them to Postgres.
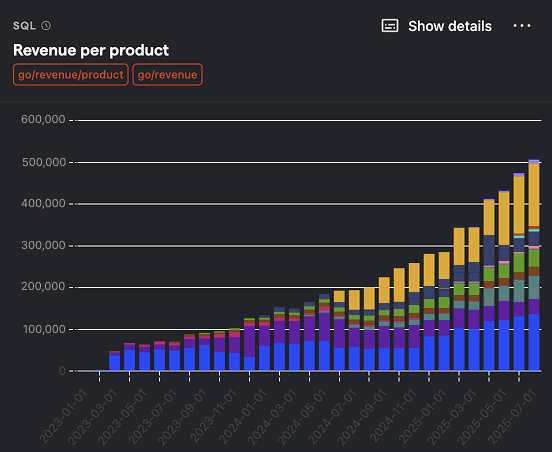
For multiple years, we used Metabase to query and visualize all this revenue data from Postgres. All of the cleanup and reformatting needed to make it usable was in there too. Moving all this to PostHog was a lot of work (it had its own project Slack channel), but we've done it now and it looks like this:
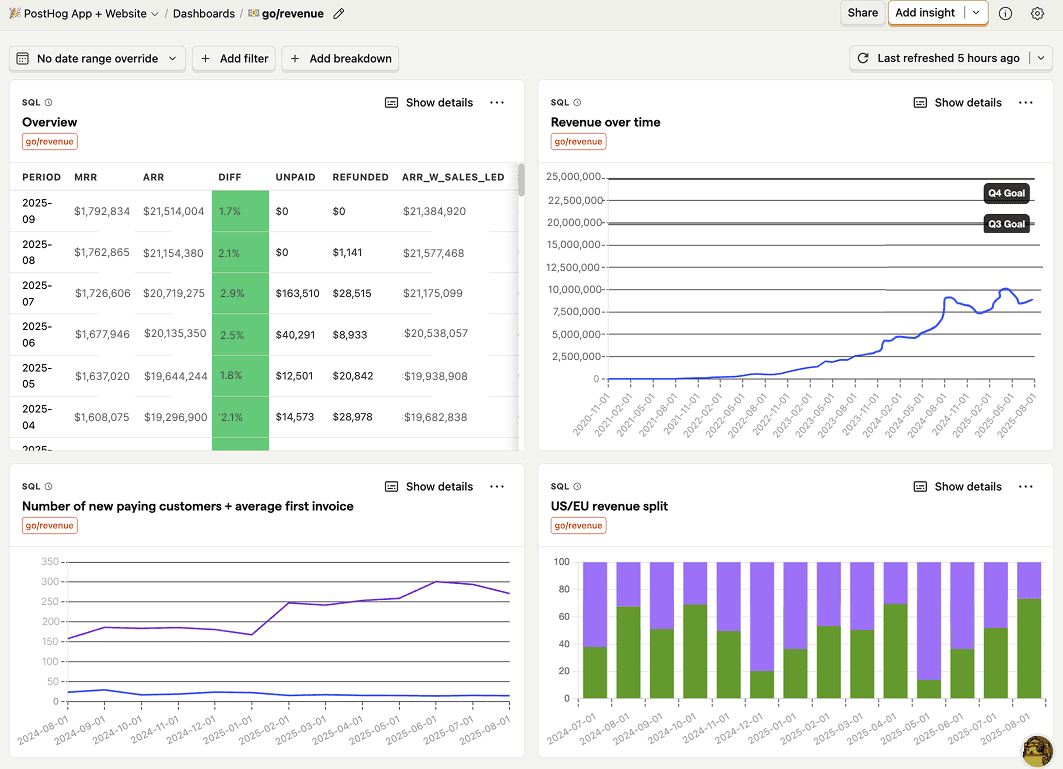
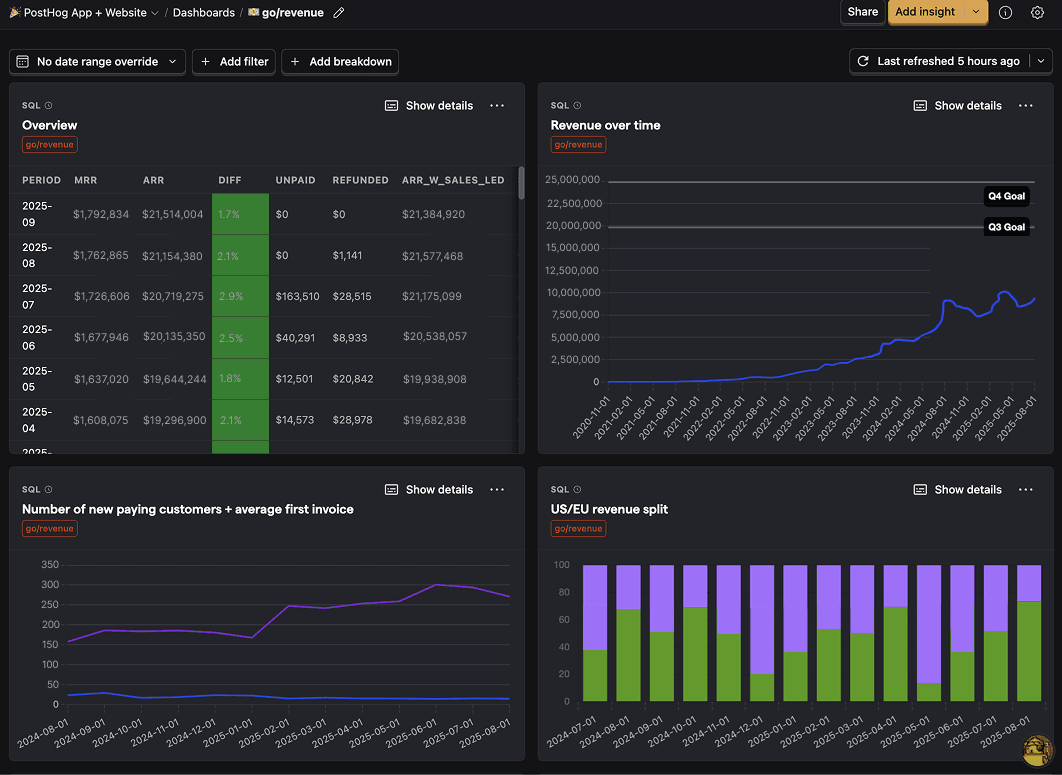
Rebuilding (and improving) these insights required us to build views that standardize the data, connect Salesforce to better project revenue, create SQL visualizations we were missing, and more. Overall, the project was a success both in terms of making our revenue data more accessible and improving our data warehouse as a product.
Our PostHog revenue dashboard now includes insights like the following (powered by the data warehouse):
US/EU revenue split
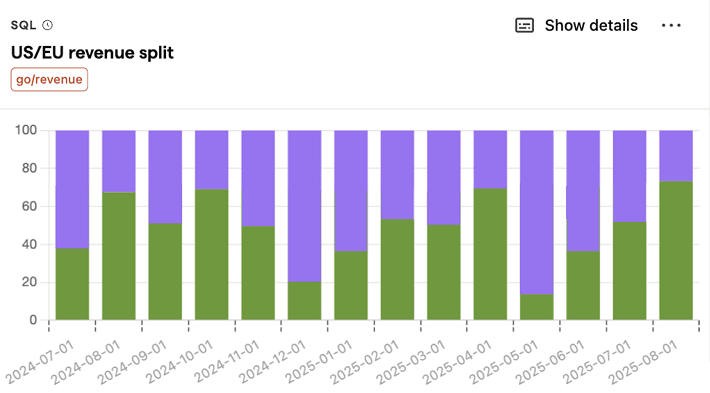
SQL query for US/EU revenue split
Revenue lifecycle


SQL query for revenue lifecycle
Revenue per product
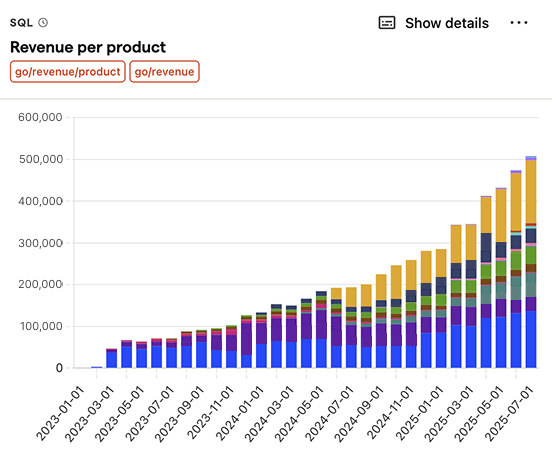
SQL query for revenue per product
Problem #3: Creating quarterly sales and customer success reports
- Sources:
- Salesforce for sales context (e.g. ICP scores)
- Postgres for billing data
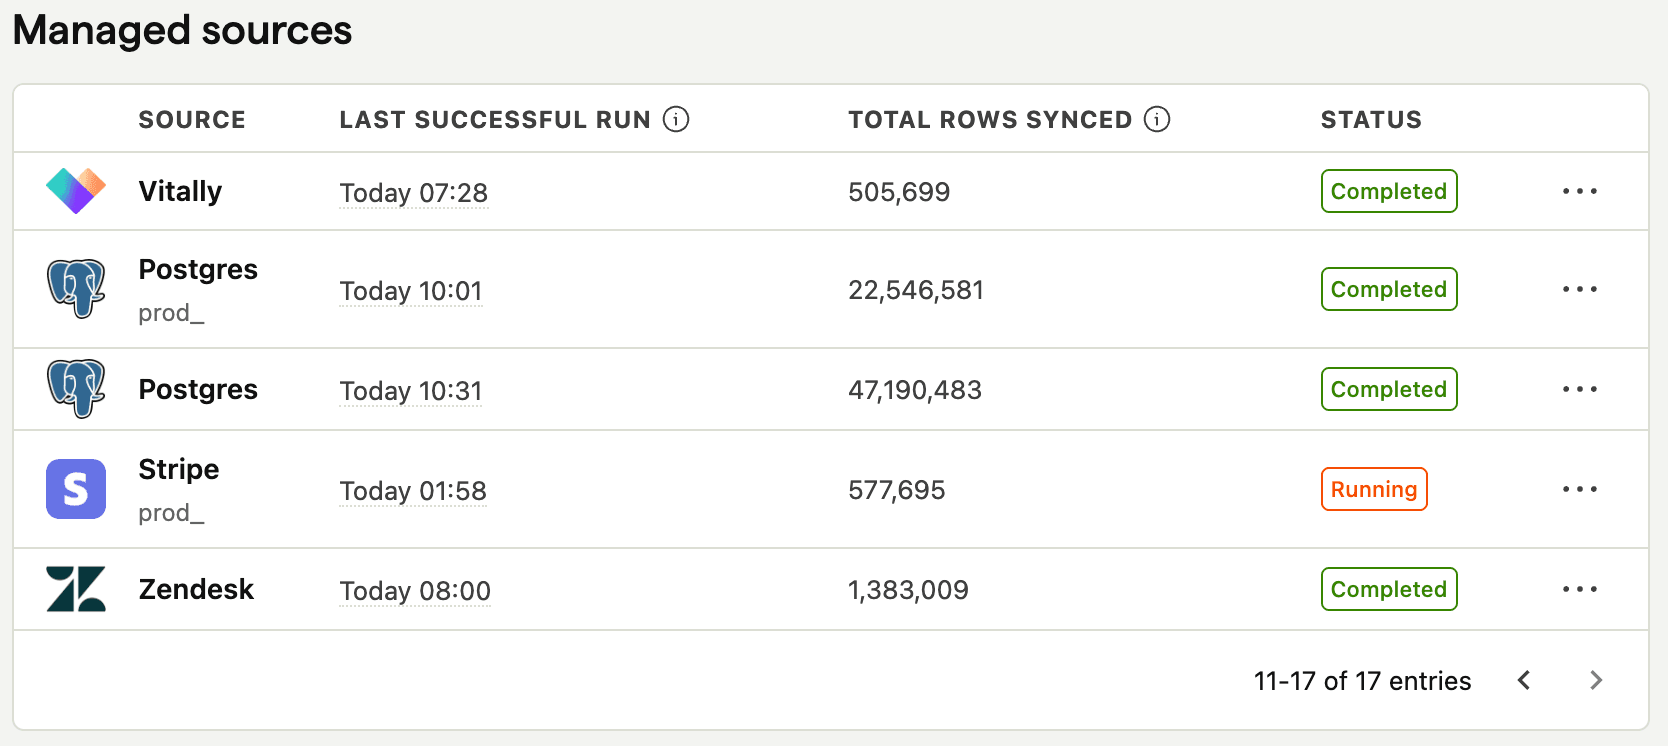
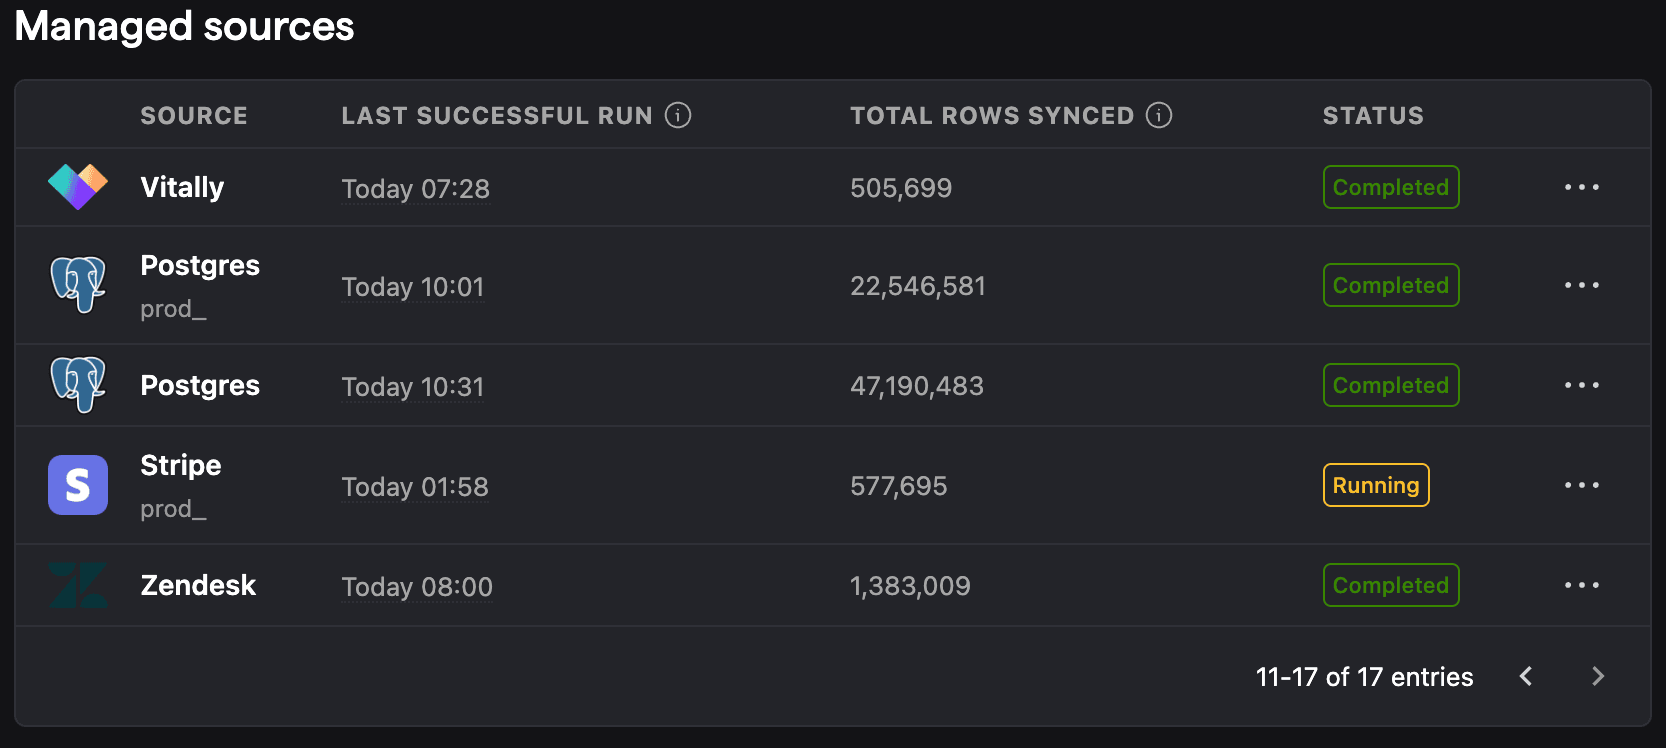
- Vitally for account ownership details
- Tables:
invoice_with_annual_plans_shifted,vitally_all_managed_accounts,salesforce_opportunity,salesforce_user
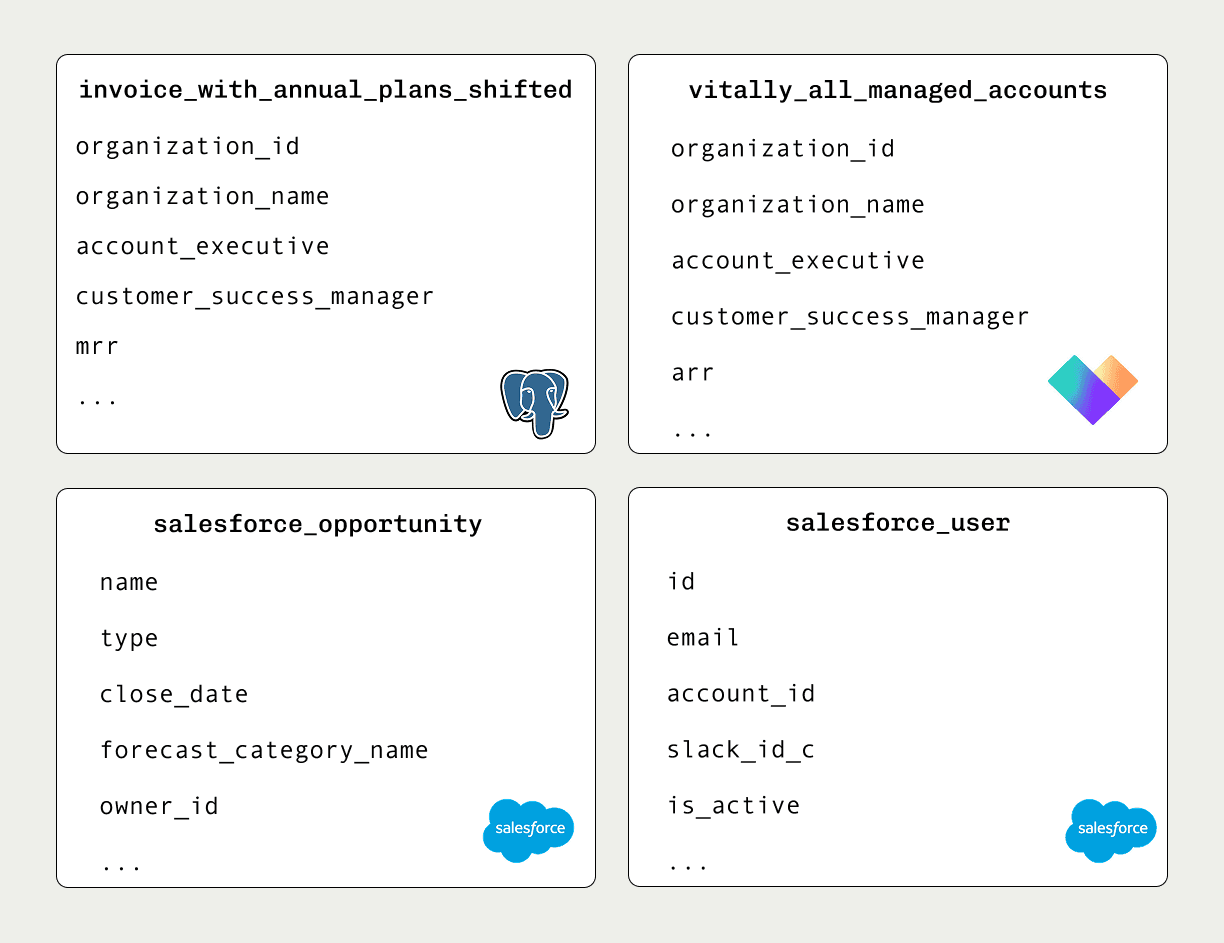
Our sales and customer success teams do reporting through PostHog. They pull from Salesforce mostly, but also billing data in Postgres and account ownership details from Vitally. These are best combined in the Sales and CS Quarter Tracker dashboard which covers details like:
- Revenue from customers managed by sales and customer success
- Details on managed customers
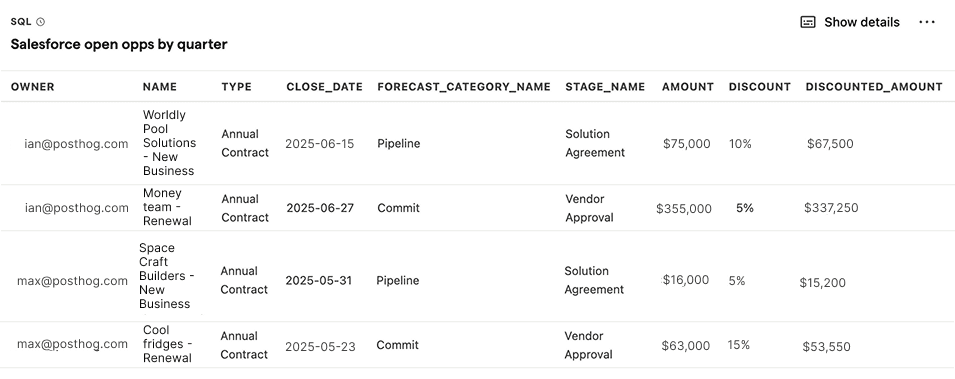
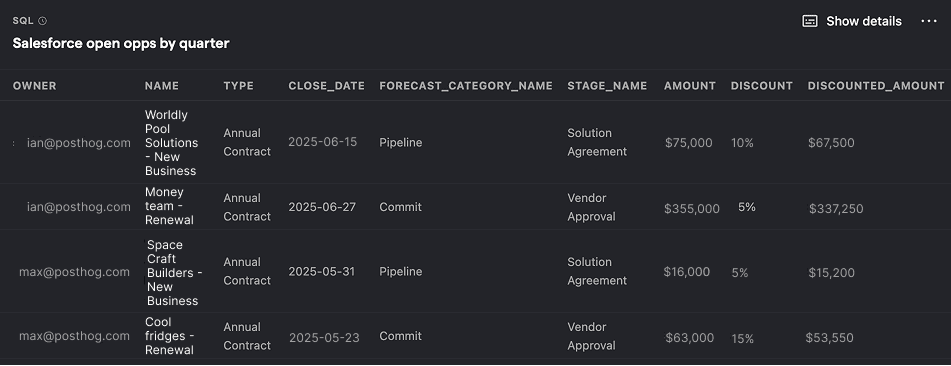
- Salesforce opportunity pipeline and how much they're worth
- Won opportunities and how much they're worth
Some examples include:
Salesforce opportunities by quarter
SQL query for Salesforce opportunities by quarter
Salesforce open pipeline by quarter (annual only)
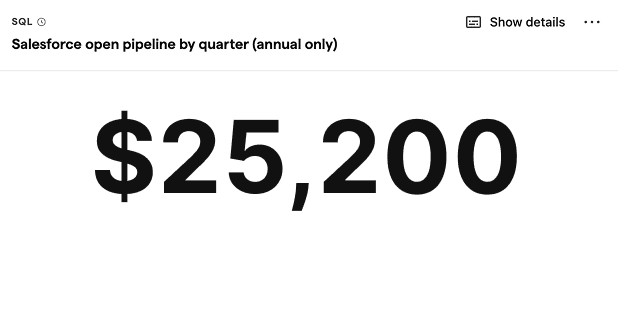
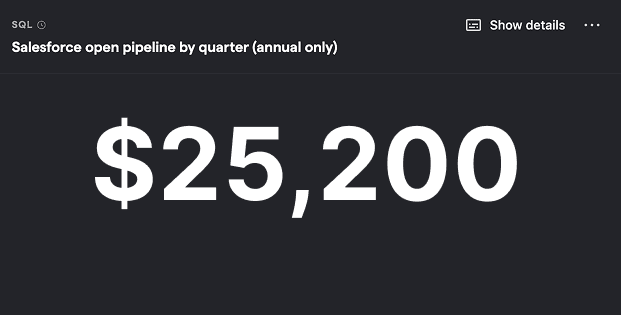
SQL query for Salesforce open pipeline by quarter (annual only)
Sales and CS managed accounts start of quarter ARR
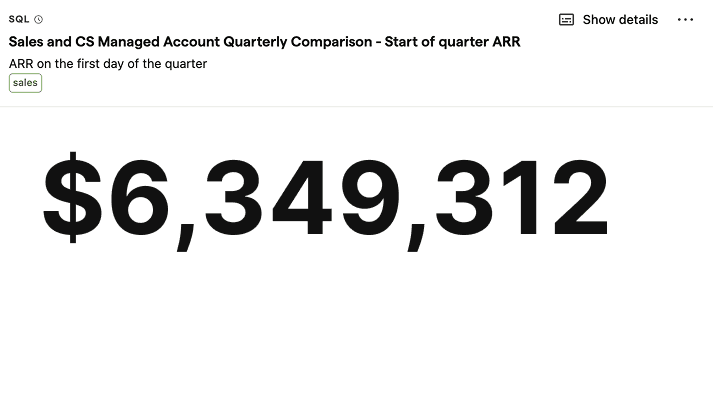
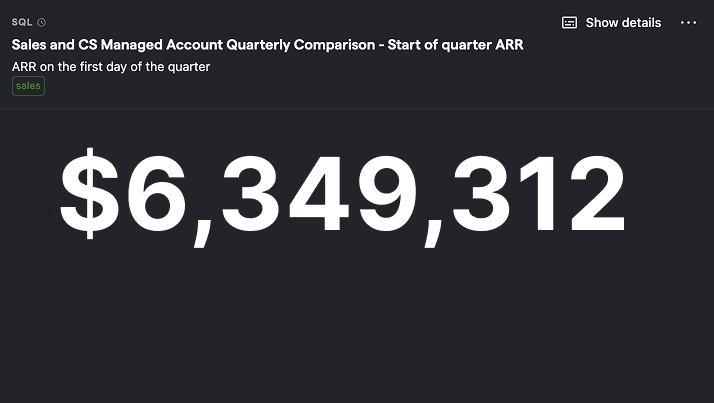
SQL query for Sales and CS managed accounts start of quarter ARR
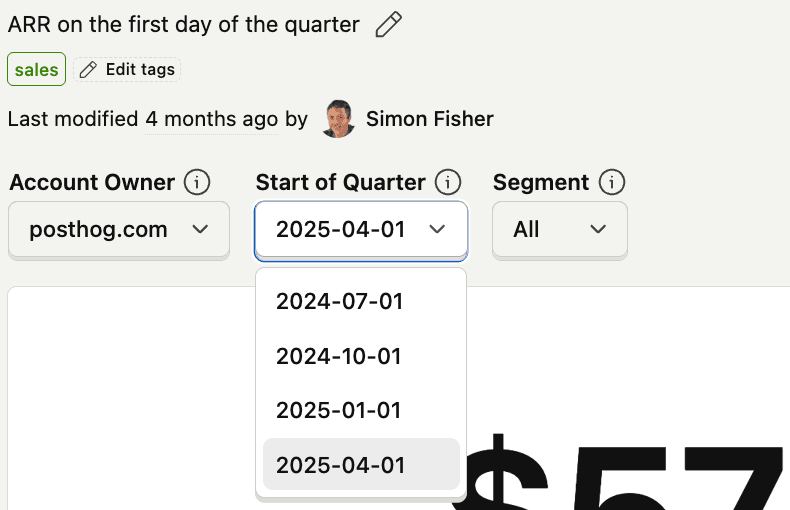
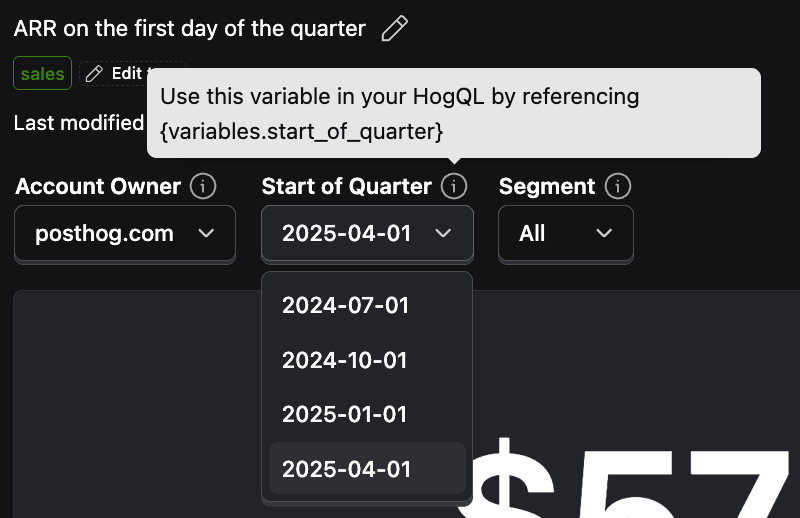
Using variables
The sales dashboard is the best example of the power of variables. Nearly every insight uses variables to set the account owner, quarter, and whether they are managed by sales or customer success.
This makes all of the insights much more reusable by being able to reuse them across quarters or for looking at individual performance.
Problem #4: Creating support reports (SLA, first response time, and more)
- Sources:
- Zendesk for ticket data
- Tables:
zendesk_ticket_events,zendesk_tickets,zendesk_ticket_metric_events,zendesk_groups
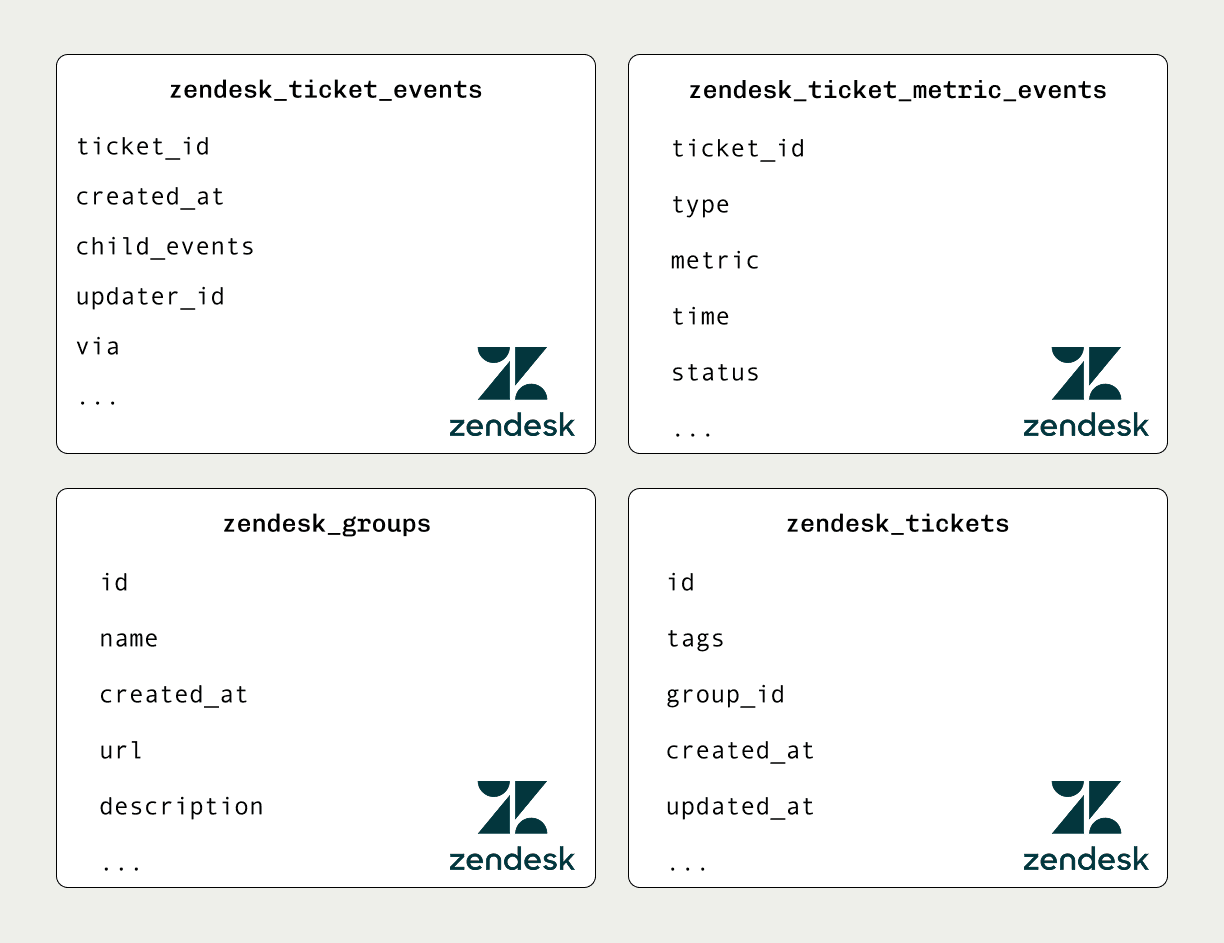
We have high standards for our support experience. Where do those standards get judged? The data warehouse, of course.
Similar to the sales and customer success teams, support does reporting through PostHog. It used to all be done in Zendesk, but since we added the Zendesk source, doing it in PostHog has become easier and better.
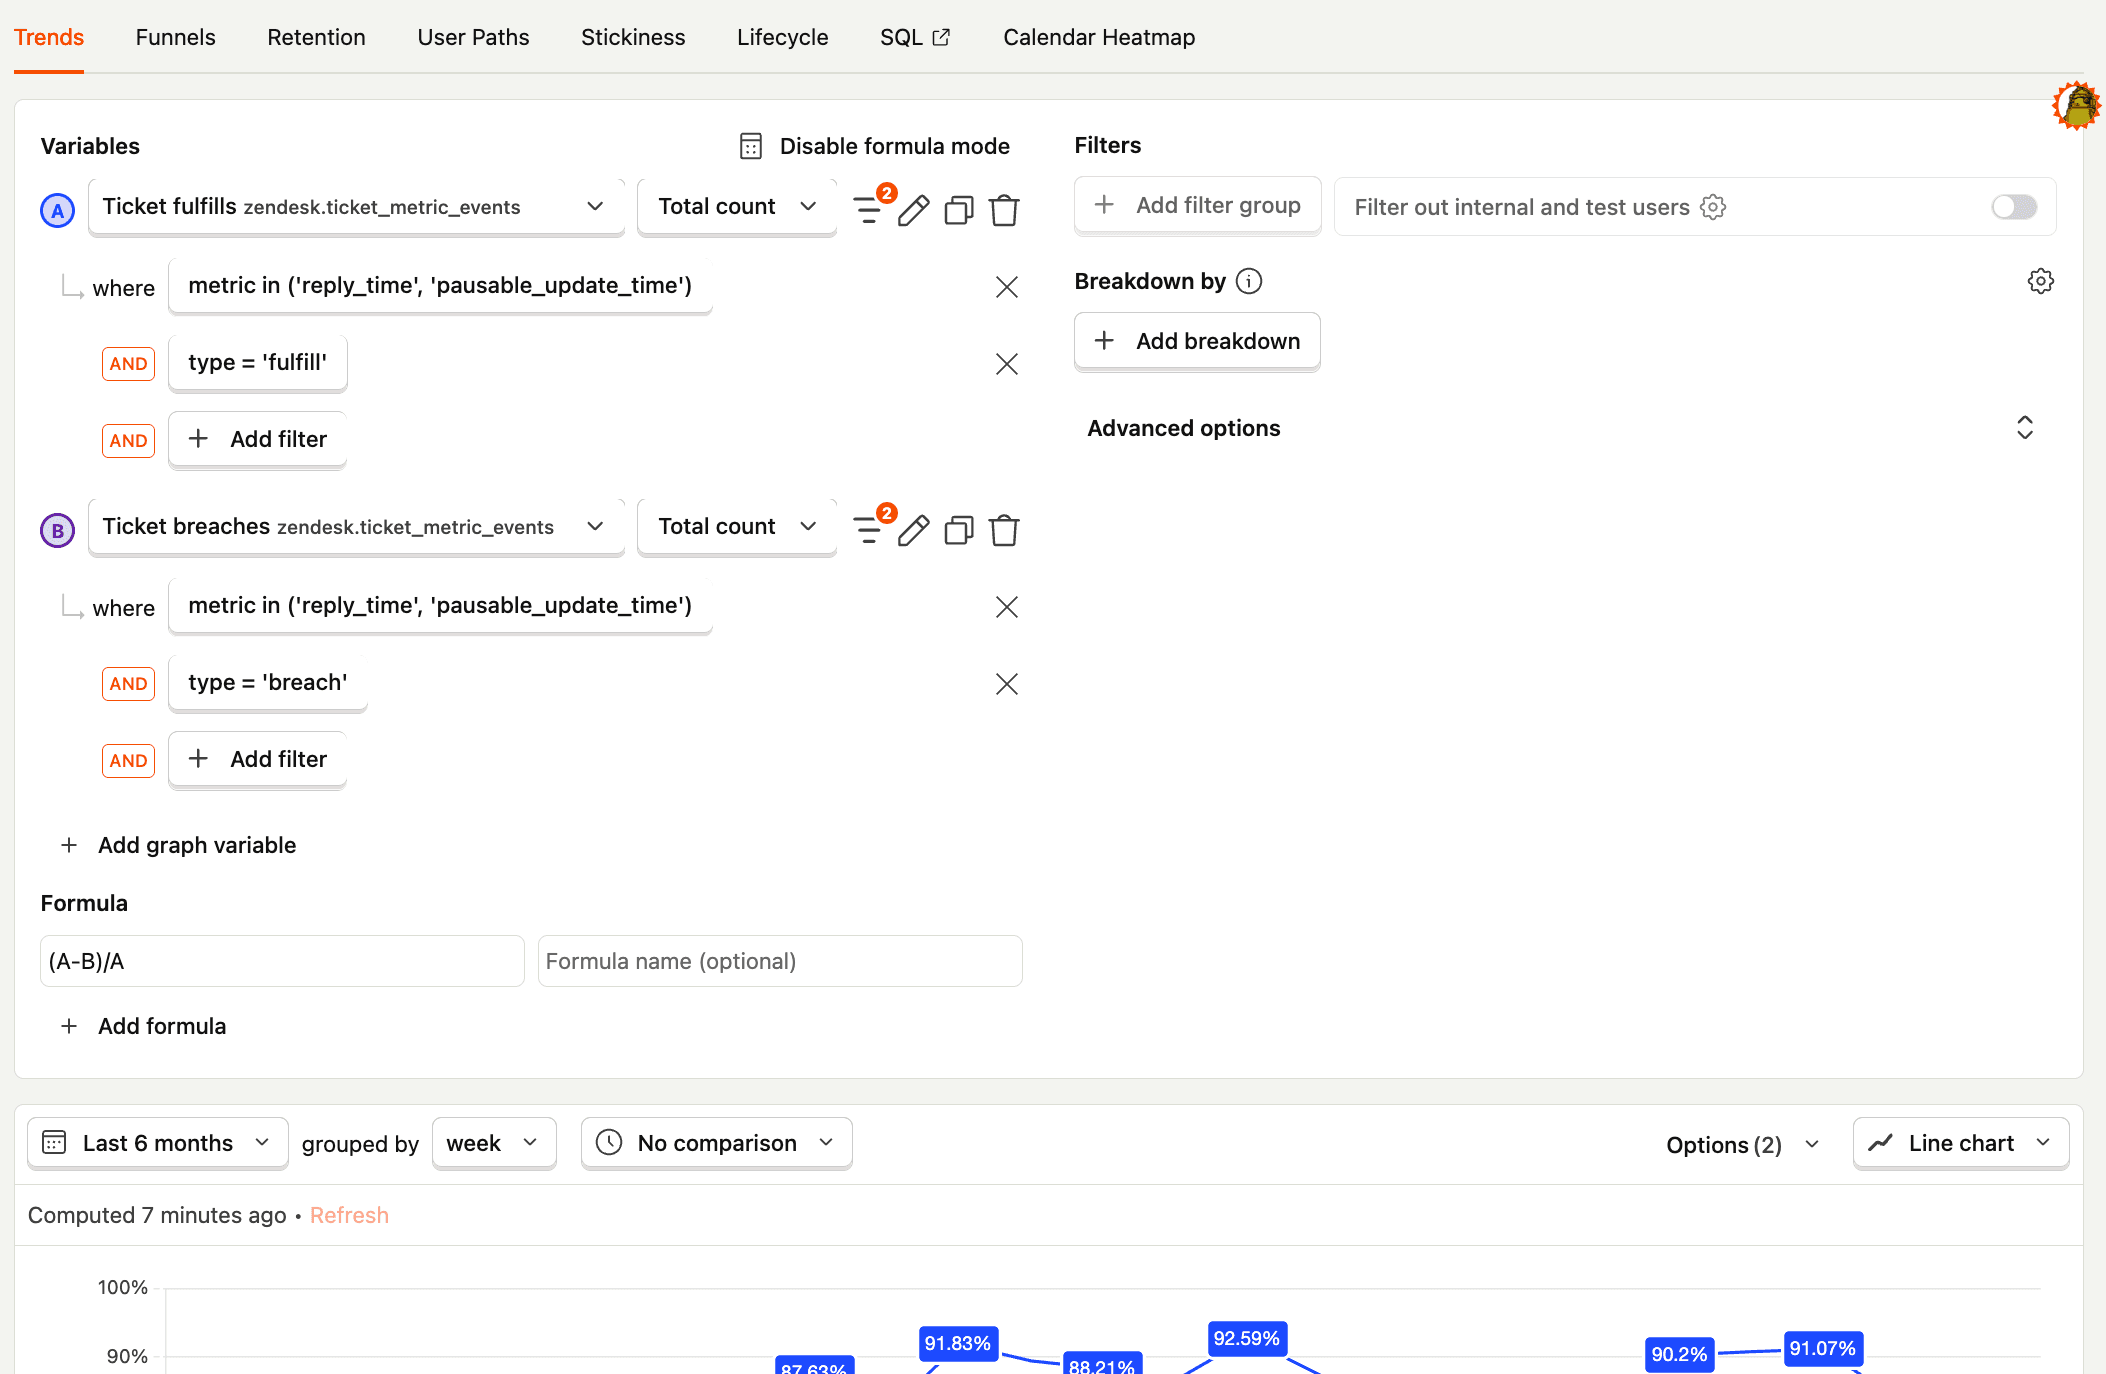
Unlike other teams, support almost always uses exclusively Zendesk. This means less complicated queries and more opportunities to use trend insights on top of SQL insights.
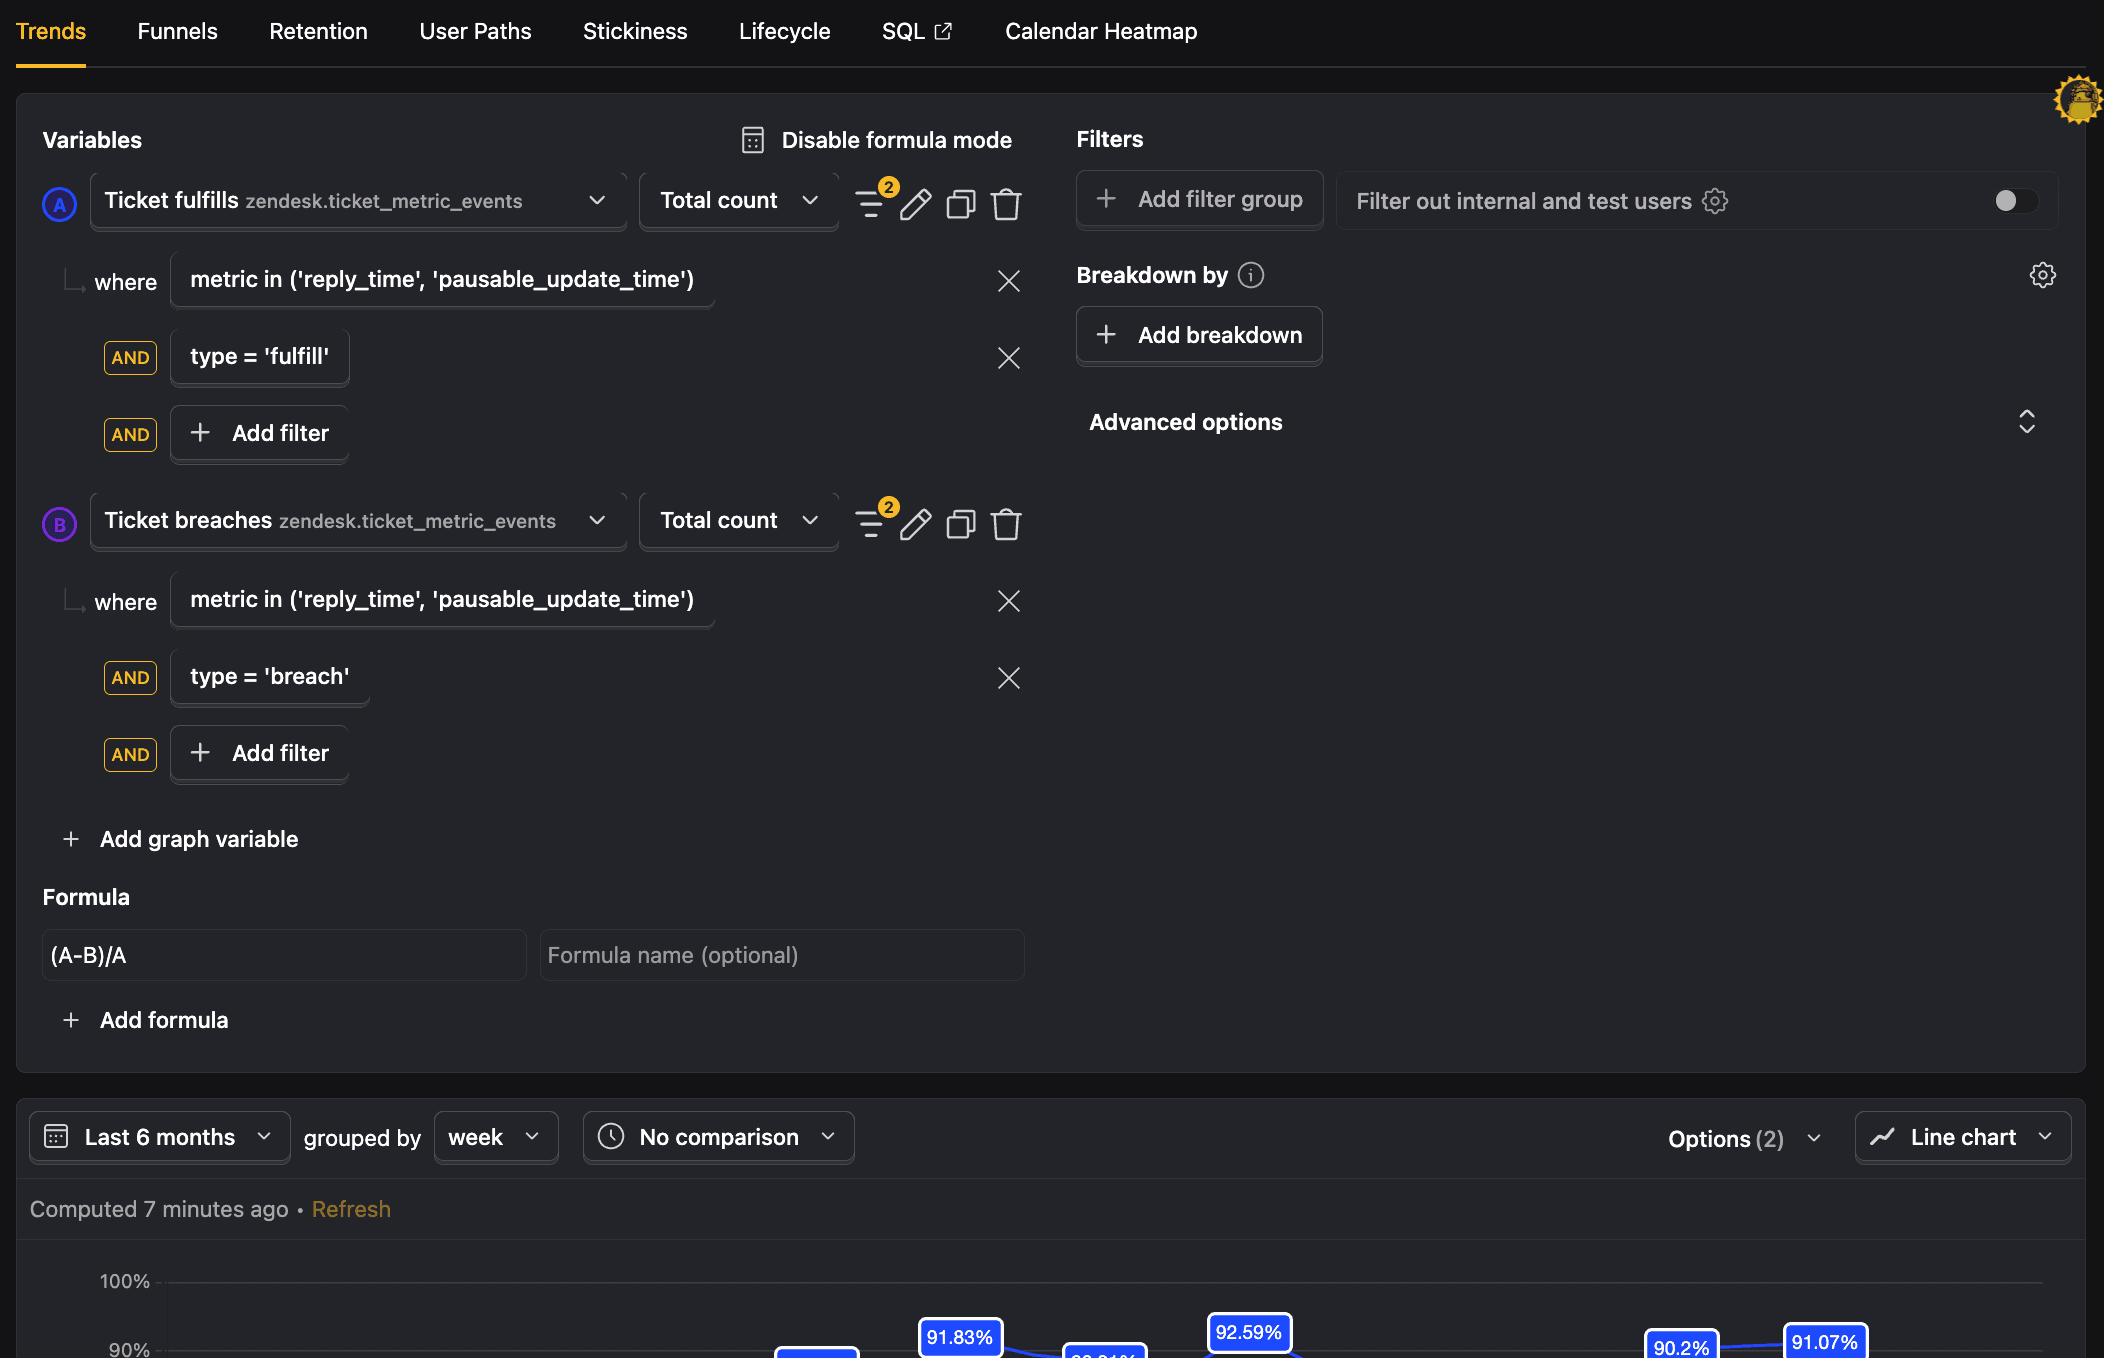
For example, our SLA Achievement Rate insight looks at the ticket_metrics_events table from zendesk to find what percentage of tickets were replied to or updated within the SLA goals we set out (no SQL required).
Beyond this, they use both insight types to track:
- Service-level agreement (SLA) and first response time goals.
- Performance and breaches on escalated tickets.
- Support load on our product teams.
- Sources of support requests.
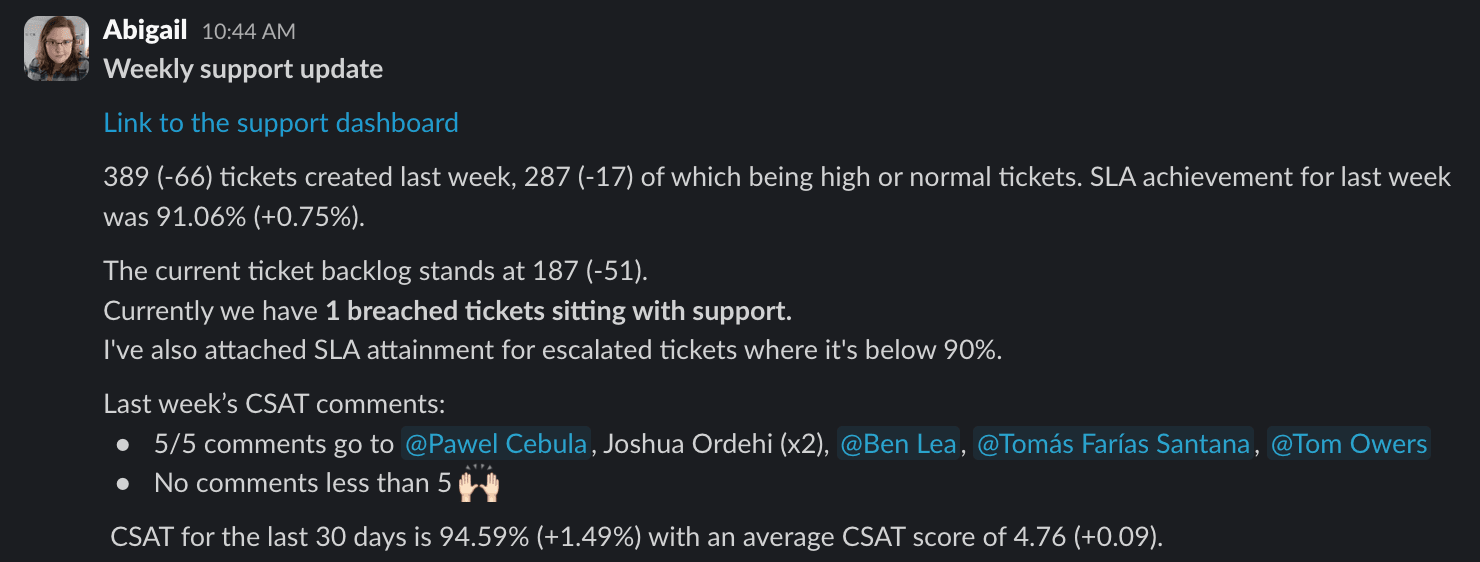
This data is combined with CSAT surveys (both scores and responses) to give a complete picture of the support we're providing at PostHog.  Abigail RichardsonAbigail Richardson writes up a summary based on this data and shares it with the exec team weekly.
Some examples of insights on the support dashboard include:
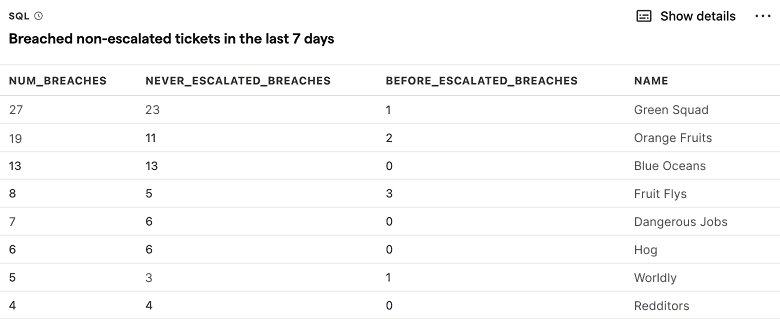
Breached non-escalated tickets in the last 7 days

SQL query for Breached non-escalated tickets in the last 7 days
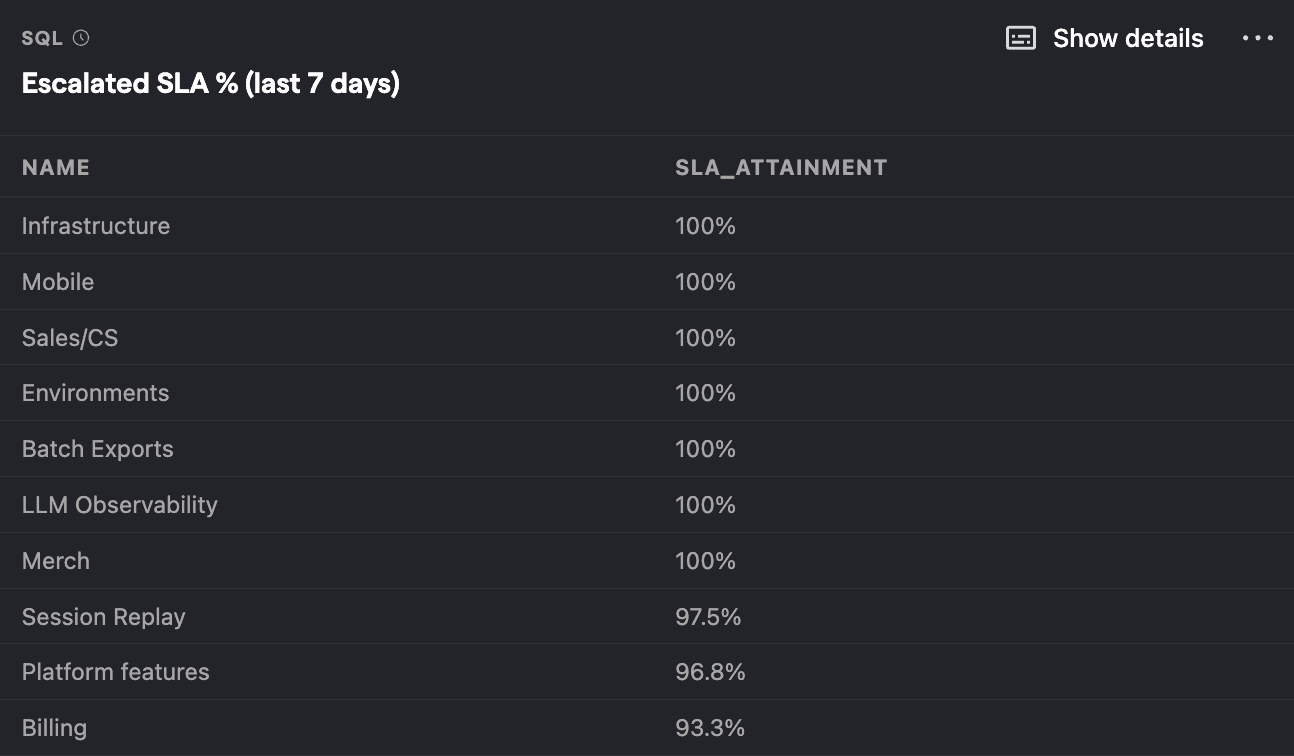
Escalated SLA % last 7 days by team

SQL query for Escalated SLA % last 7 days by team
Time UTC when tickets are created (last 6 months)

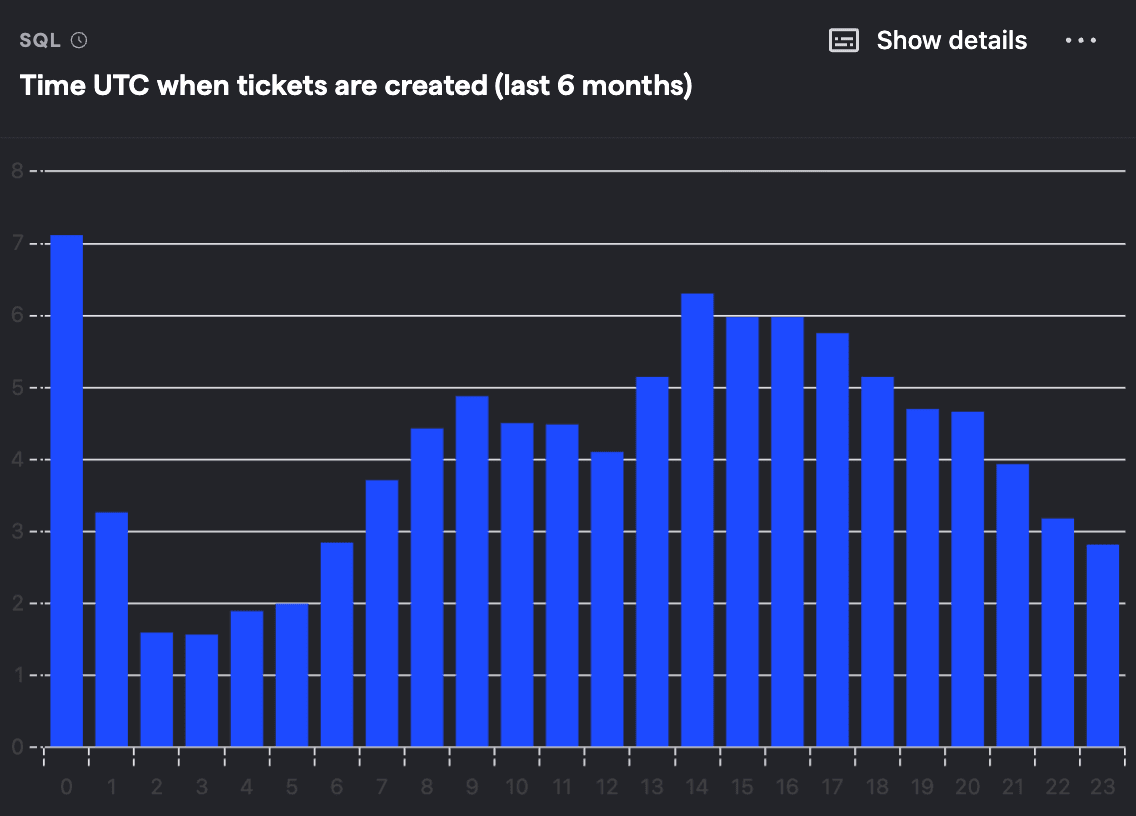
Time UTC when tickets are created (last 6 months)
Problem #5: Tracking startup and YC plan growth, costs, and ROI
- Sources:
- Tables:
stripe_customer,stripe_invoice,postgres_billing_usagereport,postgres_billing_customer
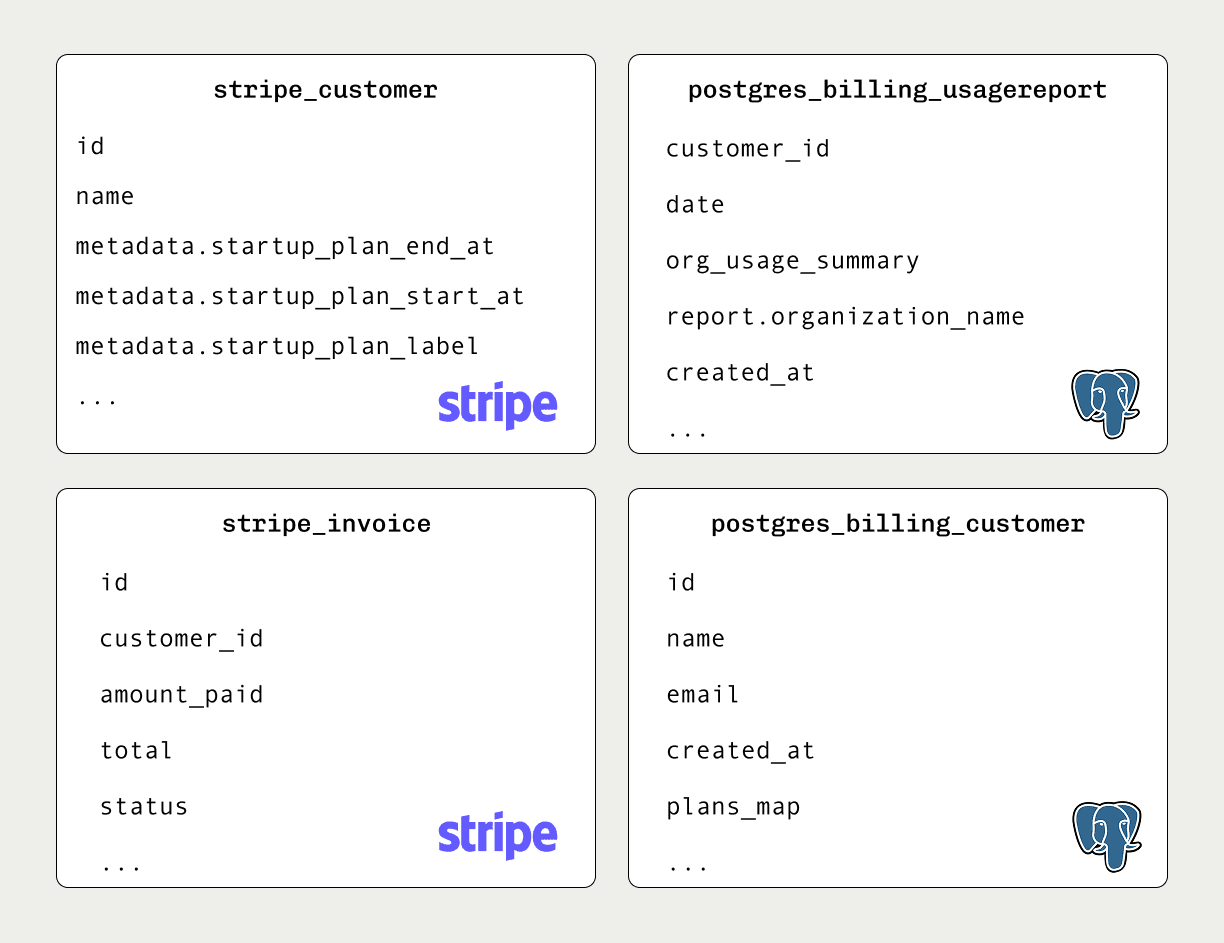
Each quarter, hundreds of startups sign up for our startup plan (which gives them $50k in free credits), dozens more sign up to our upgraded YC plan. To make sure it is going well, we have a dashboard with details like:
- The number of organizations on the startup plan
- The cost of the startup plan for us based on credit usage.
- The count of startups who “graduate” and pay us money as well as how much money they pay us.
Unlike the revenue, churn, and growth data, we actually do use Stripe for this. We have metadata on Stripe customers saying if they are a startup plan customer and what type of startup plan they are on. This helps us get the customer count as well as the “graduate” details. We can then combine the Stripe data with our billing data in Postgres to get the cost of the startup plan for us based on credit usage.
This is all put together in a Startup and YC Plan dashboard with insights like these:
Startup plan customer count (not YC)
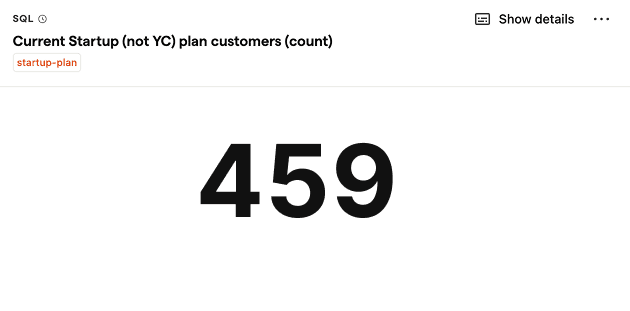

SQL query for startup plan customer count (not YC)
Previous startup & YC plan customers revenue per customer
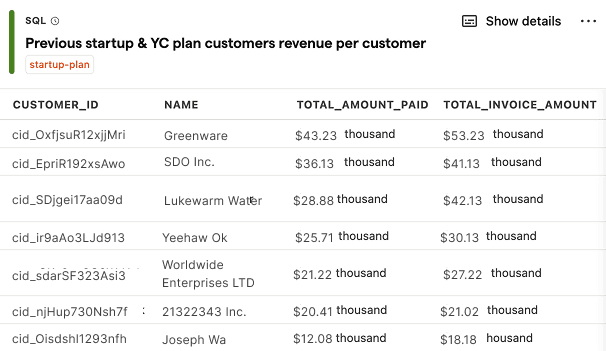
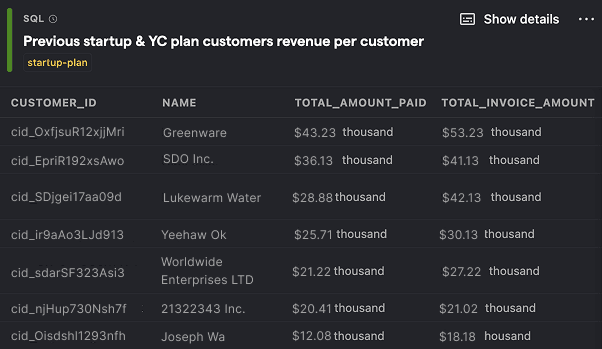
SQL query for previous startup & YC plan customers revenue per customer
Startup & YC plan customers cohorts by starting month

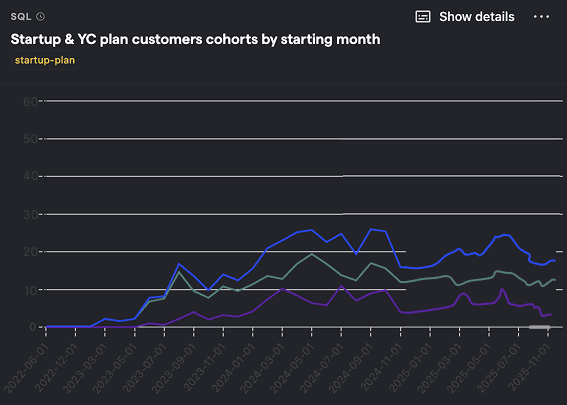
SQL query for startup & YC plan customers cohorts by starting month
How should you get started?
Feeling inspired? Here's how you can get started:
- Start by linking a source from a tool you already use.
- Go to the SQL editor and start by writing a basic query like
select * from events limit 10. - Layer more complexity, like filtering, aggregating, and joining data. Use PostHog AI to help you with this.
- Use our SQL visualizations to see your data in a new way.
- Build a dashboard of related insights and share them with your team.
PostHog is an all-in-one developer platform for building successful products. We provide product analytics, web analytics, session replay, error tracking, feature flags, experiments, surveys, AI Observability, logs, workflows, endpoints, data warehouse, CDP, and an AI product assistant to help debug your code, ship features faster, and keep all your usage and customer data in one stack.