

Querying the data warehouse with SQL
Contents
PostHog provides the full flexibility of SQL to query your data warehouse using the SQL editor.
To create a query, go to the SQL editor. Here you can see and search the schema of all available sources and PostHog tables as well as saved views.


Here you can:
- Write your SQL query using your table like
SELECT * FROM stripe.prod.charge - Click Run to see the results.
- Modify your query using SQL commands and functions as needed to get the data you want like
select amount / 100 as dollar_charge, status from stripe.prod.charge.


- Click Create insight.
- Choose and customize your visualization.
- Click Save insight.
PostHog AI can help write SQL for you. Just click the icon in the corner of your screen and ask it to write or tweak your query for you.
Working with multiple queries
The SQL editor supports writing multiple queries in a single tab, separated by semicolons. When you click Run or press Cmd+Enter (Mac) / Ctrl+Enter (Windows/Linux), only the query under your cursor executes. The active query is highlighted with a blue background so you can see which one runs next.
For example, if your editor contains:
Placing your cursor on the second line and clicking Run executes only SELECT count(*) FROM persons.
If you manually select text in the editor, pressing Cmd+Enter runs the selected text instead.
Running subqueries
Press Cmd+Shift+Enter (Mac) / Ctrl+Shift+Enter (Windows/Linux) to run the innermost subquery at your cursor position. This is useful for testing nested queries independently.
For example, with the query:
Placing your cursor inside the inner SELECT and pressing Cmd+Shift+Enter runs only SELECT id, event FROM events WHERE event = 'pageview'.
Subqueries that may fail when run standalone — such as those referencing CTEs defined elsewhere — show a wavy yellow underline with a tooltip explaining the issue on hover.
SQL visualizations
SQL queries have multiple visualization options including:
- Auto (default) - automatically selects the best chart type based on your query results
- Table
- Big number
- Line chart
- Bar chart
- Stacked bar chart
- Area chart
- 2D heatmap
Note: Line chart and area chart require a date or datetime column in the query results.
By clicking on the Visualization tab below the query, you can customize the X-axis, Y-axis, legend, scale, goal lines, and more. Each visualization type has its own set of customization options.
In the Series tab, you can format numerical columns with different number styles:
- None - Display raw values
- Number - Standard number formatting
- Short Number - Compact format for large numbers (e.g., 1,200 displays as "1.2K", 1,500,000 as "1.5M")
- Percentage - Display values as percentages
You can also set a prefix, suffix, and decimal places for each series.
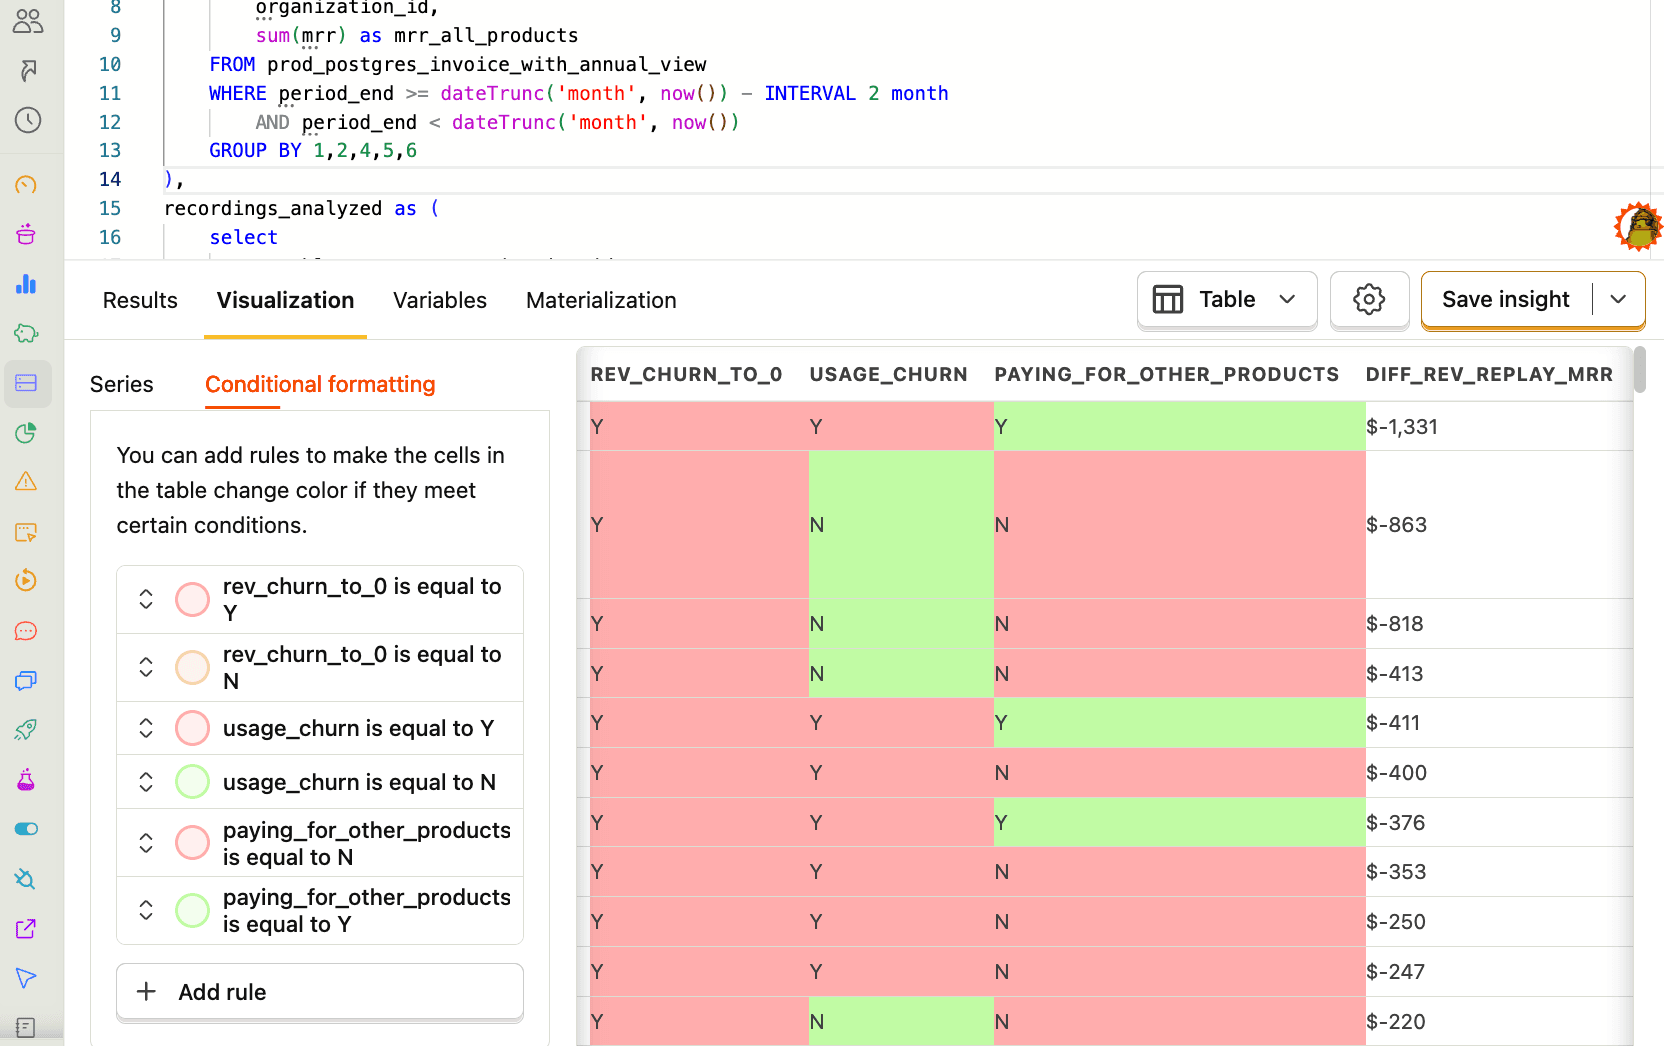
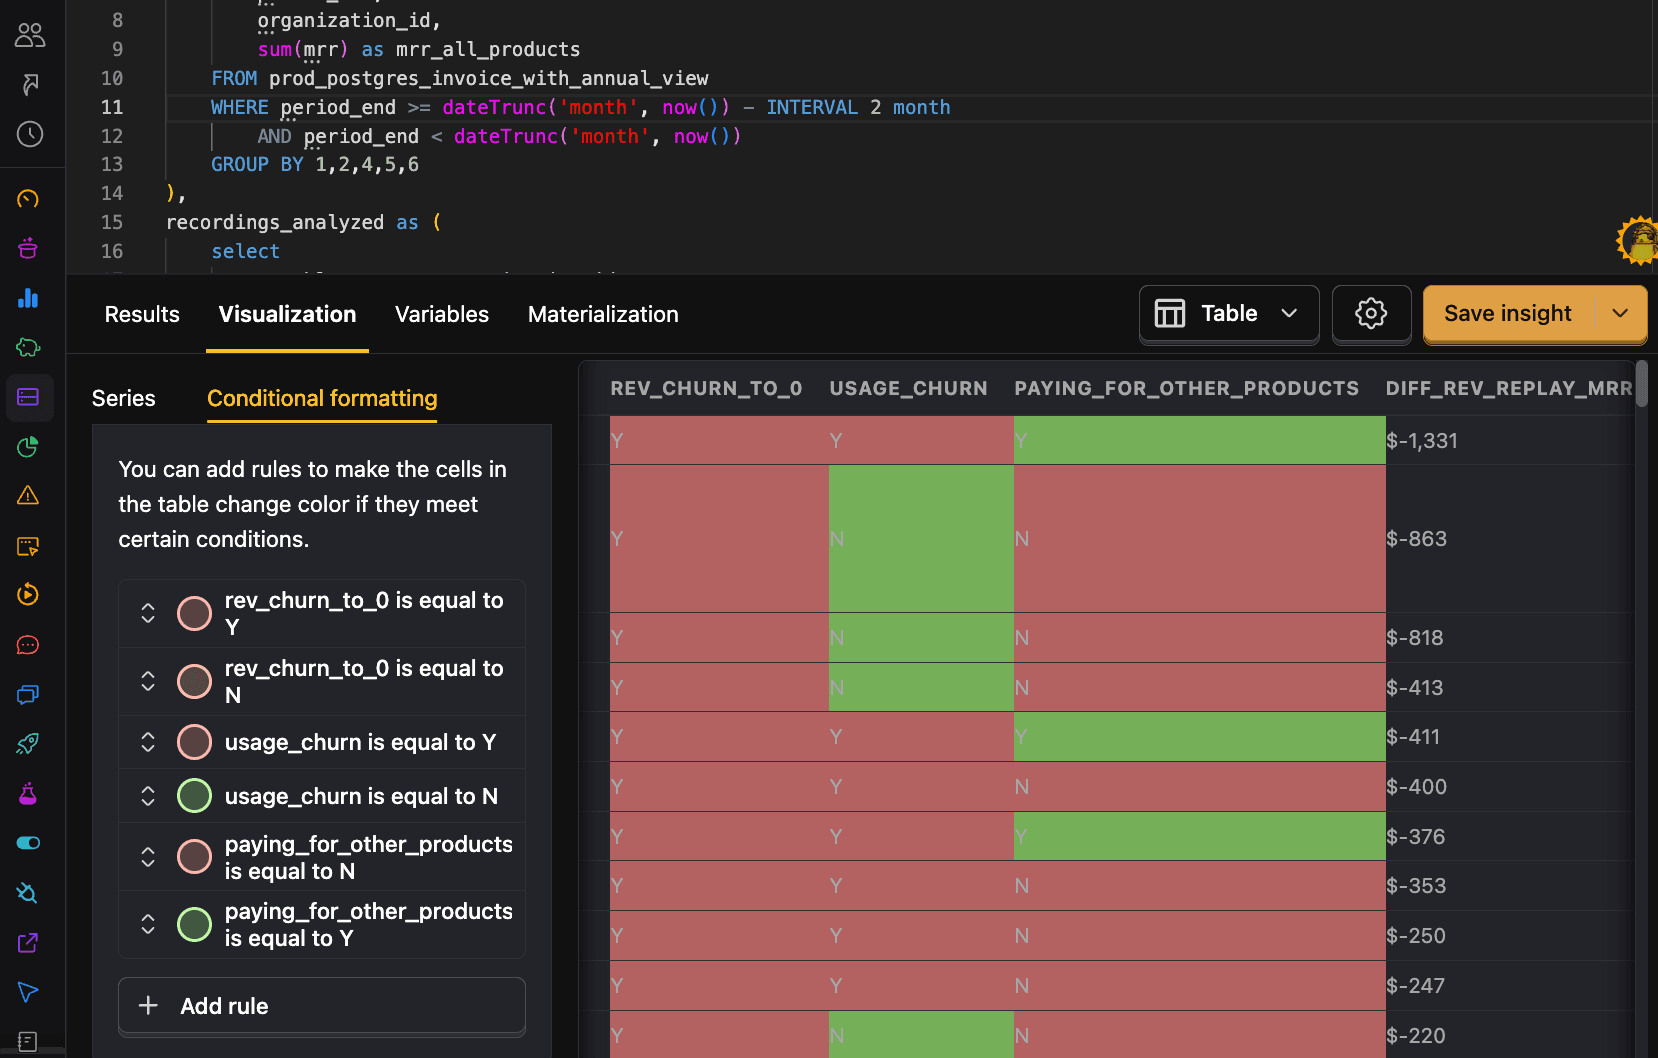
For example, with tables, you can add conditional formatting rules. These enable you to highlight cells based on their value and are set up in the Conditional formatting tab.
Querying multiple sources together
Much of the power of the data warehouse comes from combining multiple sources, like your Stripe or Hubspot data with your product analytics data. Two of the easiest ways of doing this are WHERE IN and JOIN SQL commands.
For example, to get a count of events for your Hubspot contacts you can filter events.distinct_id by email FROM hubspot_contacts like this:
You can also use a JOIN such as INNER JOIN or LEFT JOIN to combine data. For example, to get a count of events for your Stripe customers you can INNER JOIN on distinct_id and email like this:
To learn more about joining data, see our guide on joining data.
Query execution details
After running a query, execution details can help you understand the resource usage and execution time:
- Memory usage: Total memory consumed by the query
- Data read: Total amount of data read by the query
- CPU time: Processing time used by the CPU
- Duration: Duration of query execution in ClickHouse
Hover over Execution details to see additional information about how the query was executed.


These metrics are helpful for optimizing queries, especially when working with large datasets or complex joins. As you develop and change your query, keep an eye on the impact of your changes on the metrics. Seeing a spike in bytes read might prompt you to use a more selective filter.
Optimizing queries
When writing custom queries, the burden of performance falls onto you. PostHog handles performance for queries we own (for example, in product analytics insights and experiments, etc.), but because performance depends on how queries are structured and written, we can't optimize them for you. Large data sets particularly require extra careful attention to performance.
Here is some advice for making sure your queries are quick and don't read over too much data (which can increase costs):
1. Use shorter time ranges
You should almost always include a time range in your queries, and the shorter the better. There are a variety of SQL features to help you do this including now(), INTERVAL, and dateDiff. See more about these in our SQL docs.
2. Materialize a view for the data you need
The data warehouse enables you to save and materialize views of your data. This means that the view is precomputed, which can significantly improve query performance.
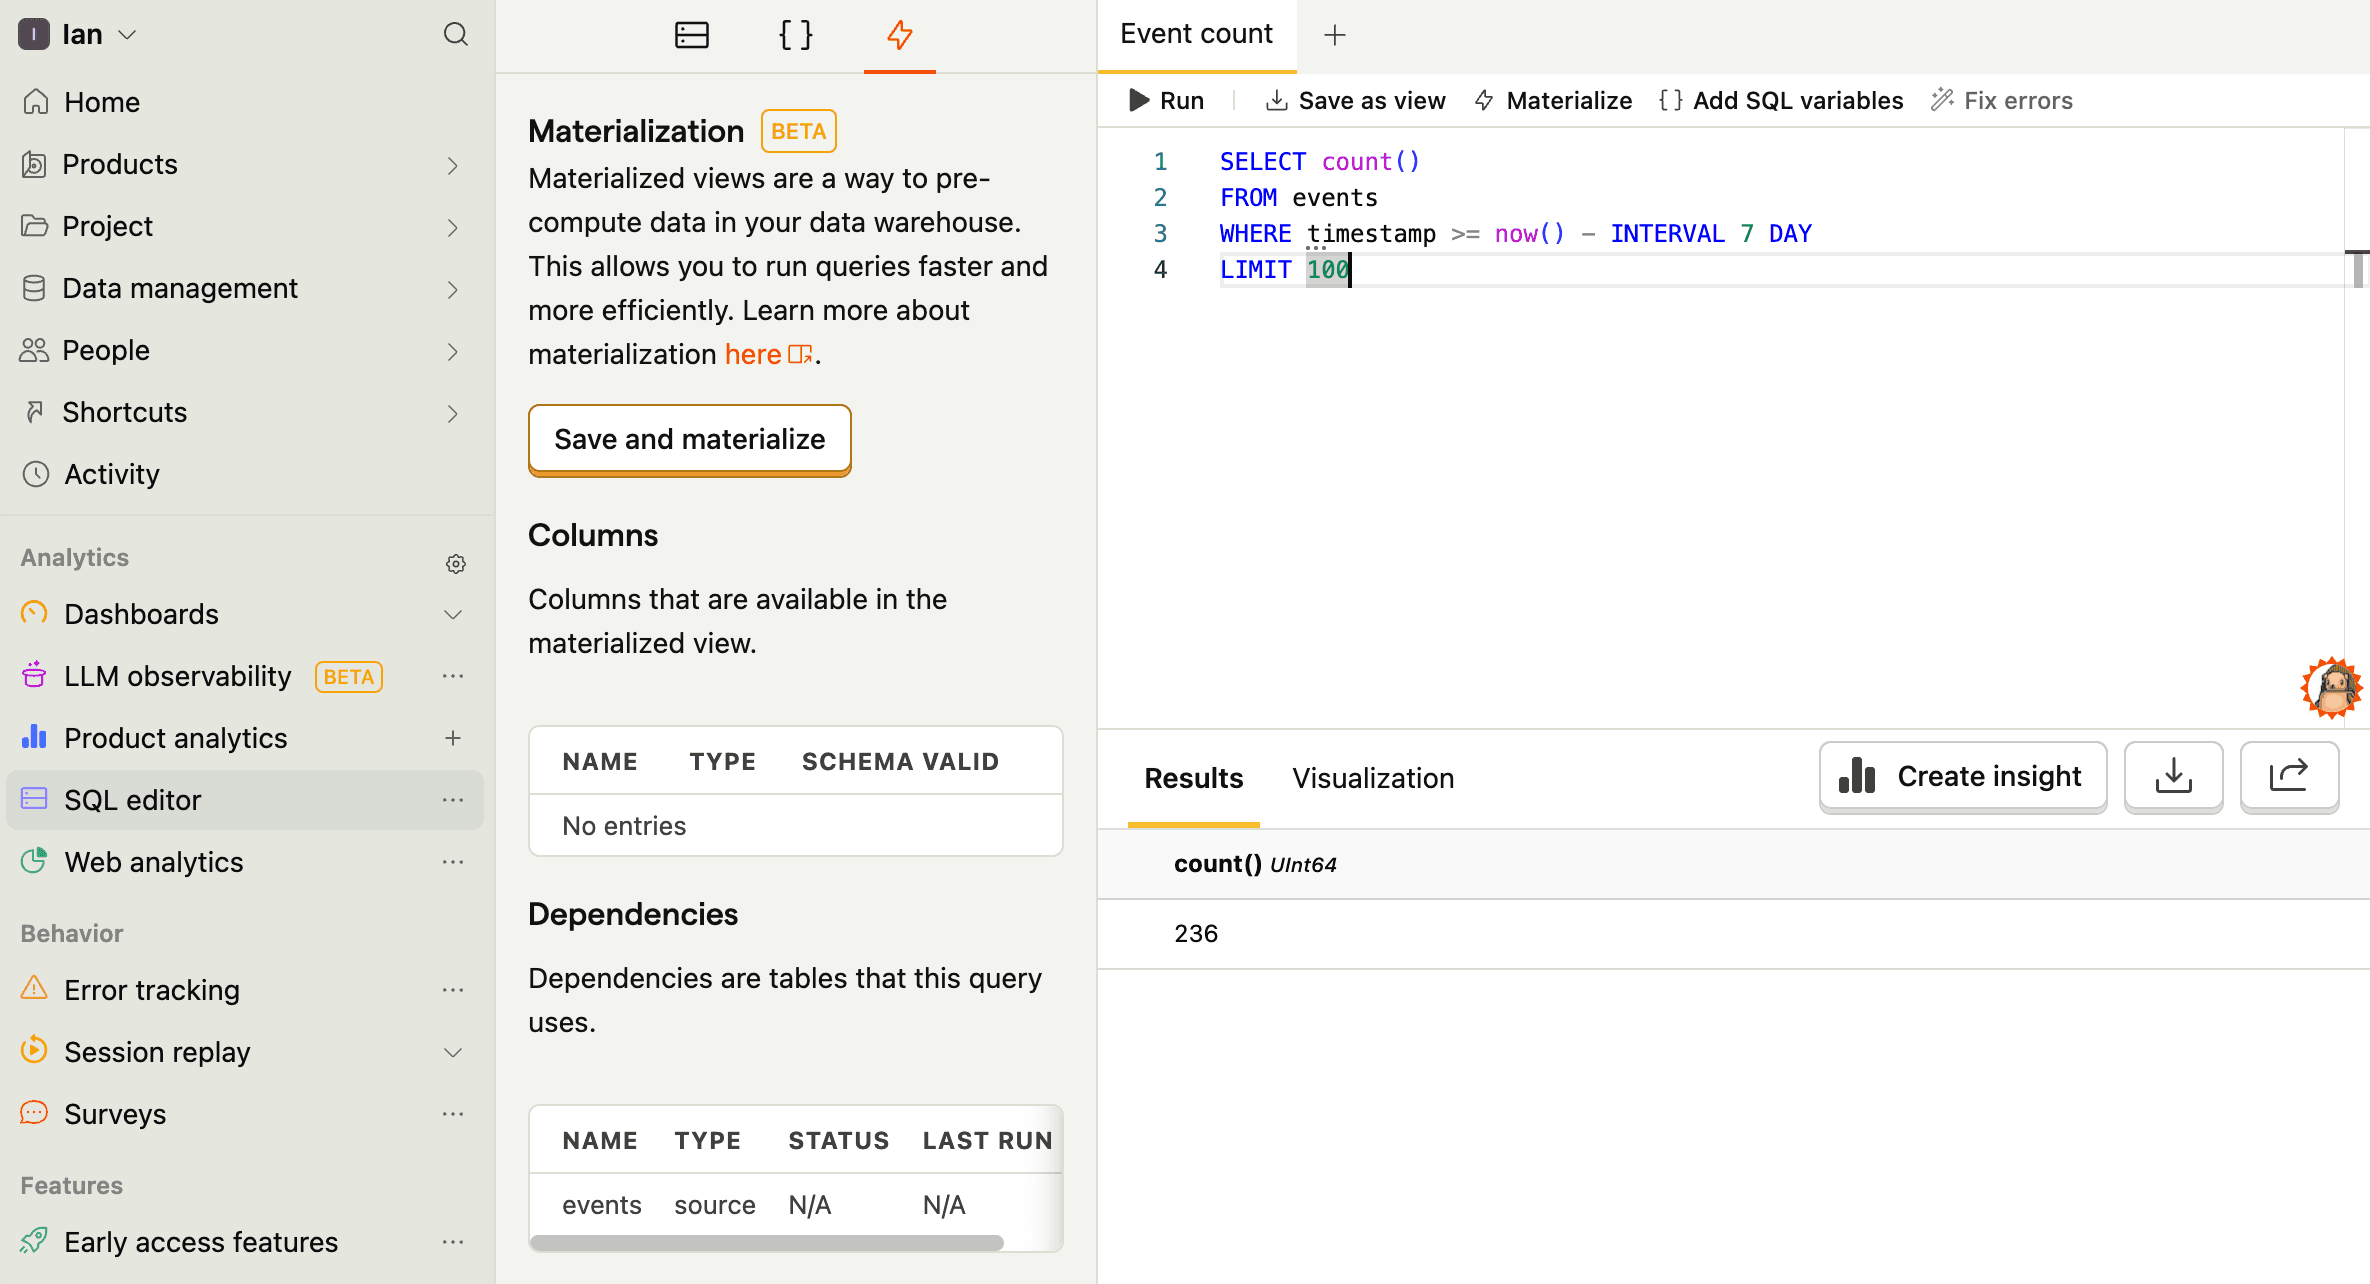
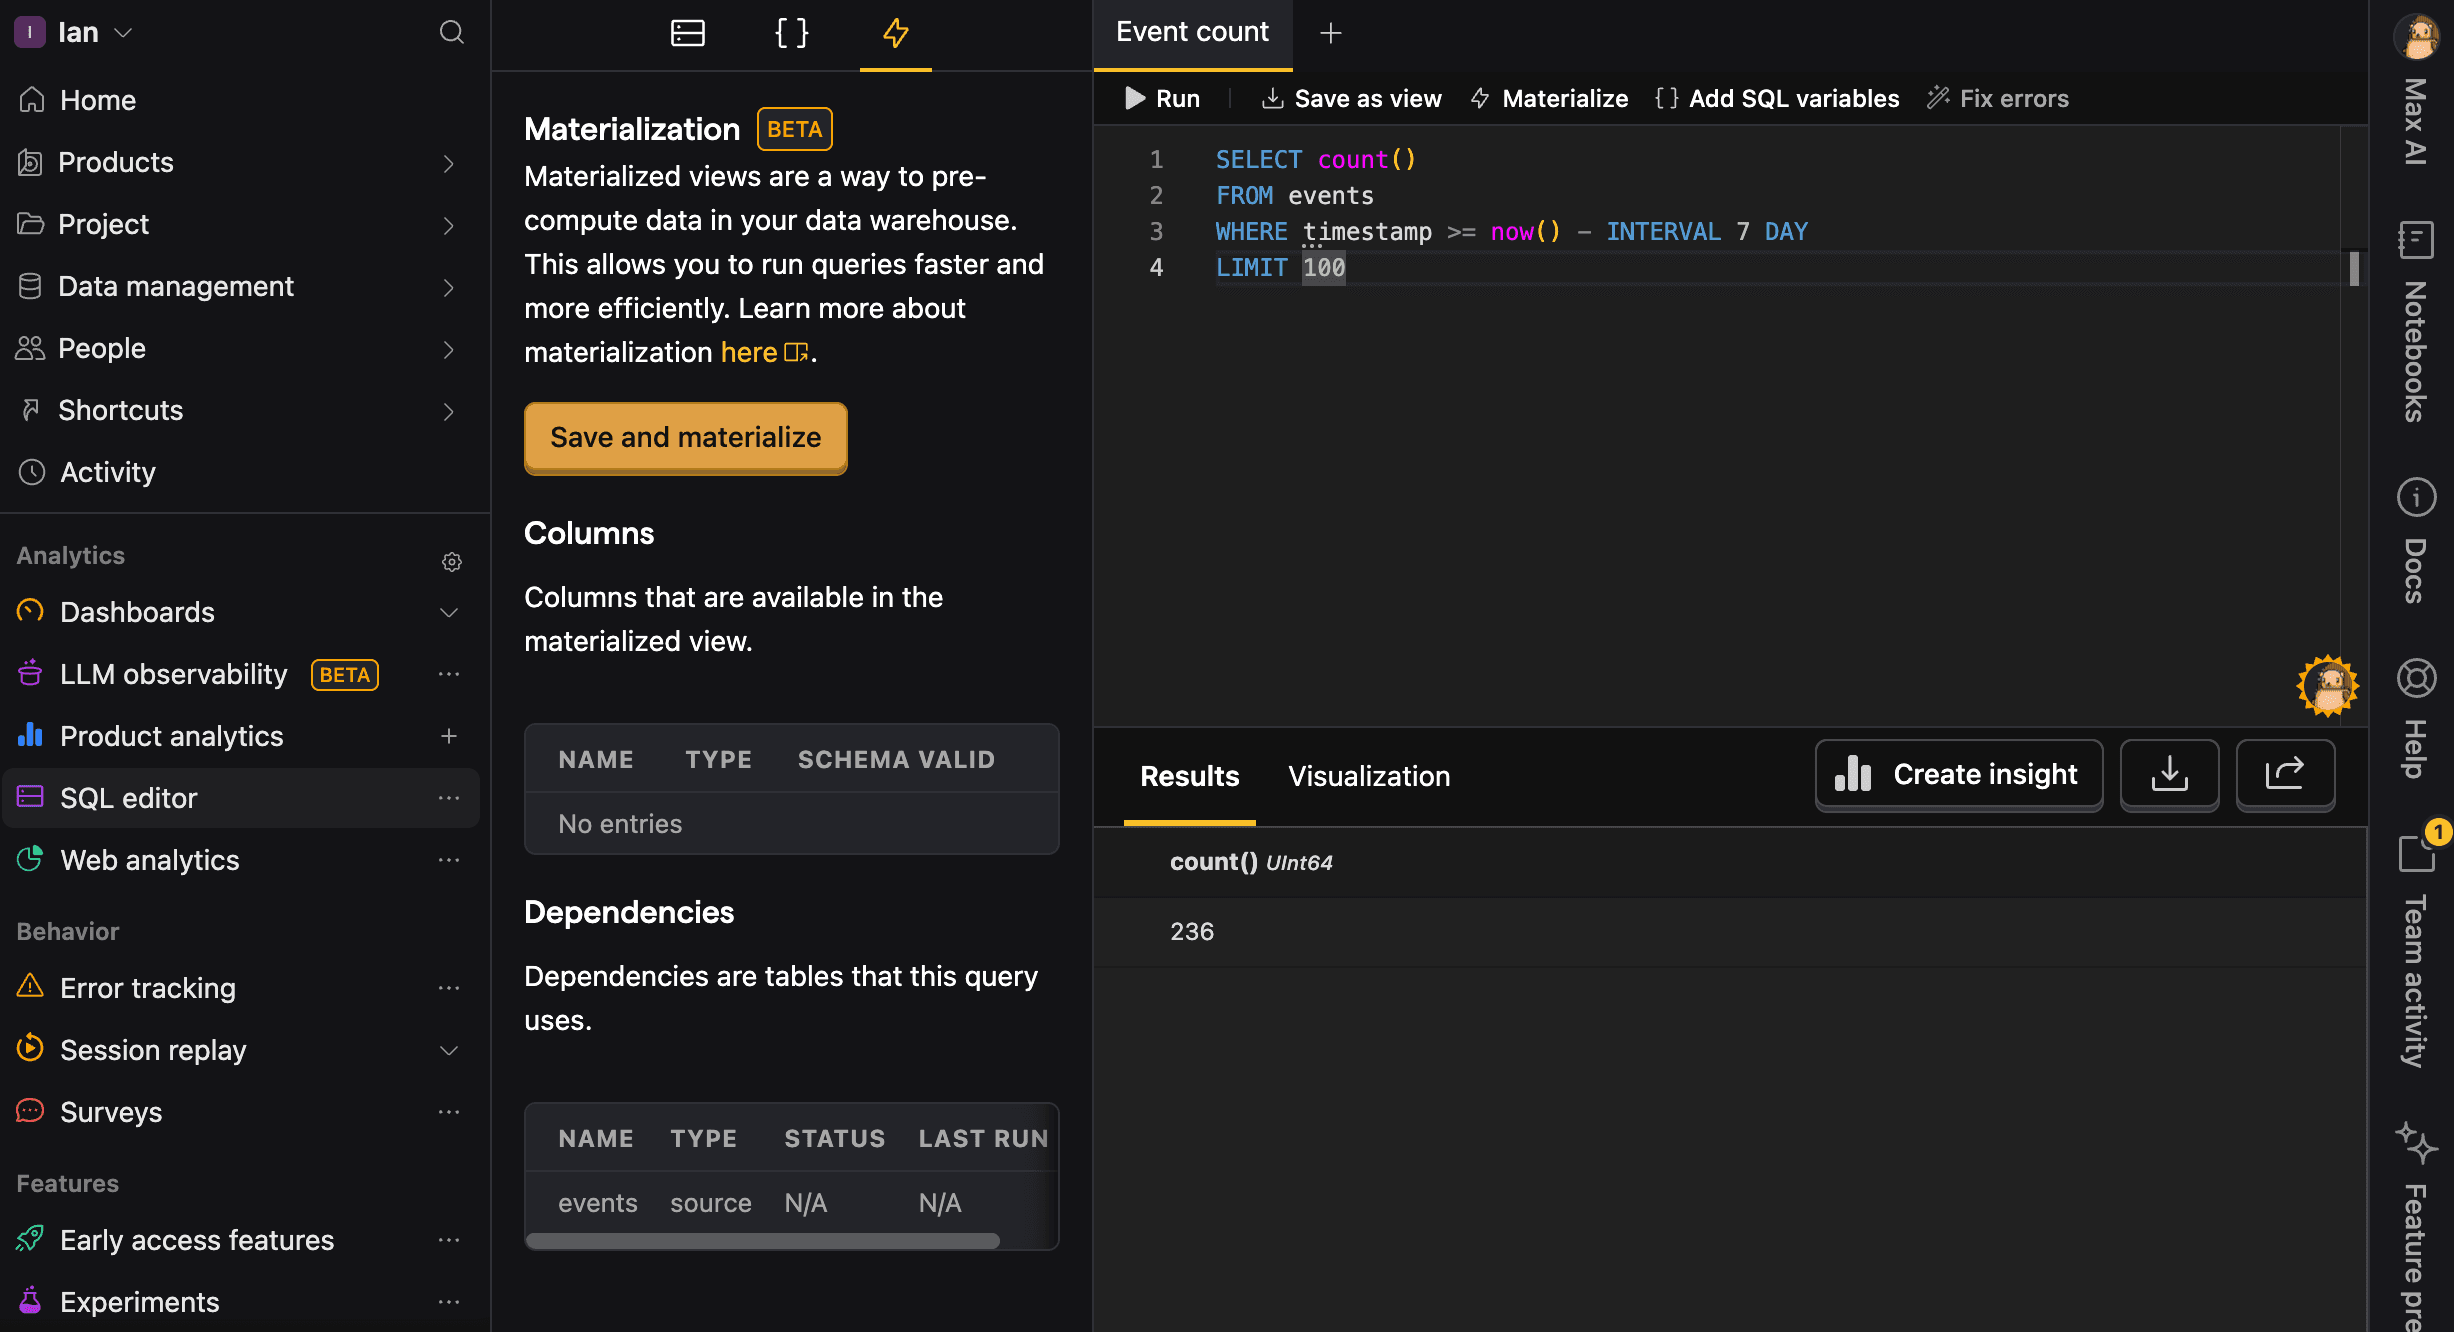
To do this, write your query in the SQL editor, click Materialize, then Save and materialize, and give it a name without spaces (I chose mat_event_count). You can also schedule to update the view at a specific interval.
Once done, you can query the view like any other table.
3. Don't scan the same table multiple times
Reading a large table like events or persons more than once in the same query multiplies the work PostHog has to do (more I/O, more CPU, more memory). For example, this query is inefficient:
Instead, pull the rows you need once and save it as a materialized view. You can then query from that materialized view in all the other steps.
Start by saving this materialized view, e.g. as base_events:
You can then query from base_events in your main query, which avoids scanning the raw events table multiple times:
4. Name your queries for easier debugging
Always provide a meaningful name parameter for your queries. This helps you:
- Identify slow or problematic queries in the
query_logtable - Analyze query performance patterns over time
- Debug issues more efficiently
- Track resource usage by query type
Good query names are descriptive and include the purpose:
daily_active_users_last_7_daysfunnel_signup_to_activationrevenue_by_country_monthly
Bad names are generic and vague:
query1testdata
5. Use keyset pagination instead of OFFSET
OFFSET pagination is not supported for programmatic requests on /query and is currently rejected with HTTP 400 for personal API keys. If you're paginating to export data, stop and use batch exports instead – /query is not a supported export path.
For ad-hoc paging, use keyset pagination on the table's sort column: timestamp for events, id for persons. Other columns (e.g. created_at) are not indexed for this and will be slow.
6. Other SQL optimizations
Options 1-5 make the most difference, but other generic SQL optimizations work too. See our SQL docs for commands, useful functions, and more to help you with this.